Available Checks for Rackspace Monitoring
In the Cloud Control Panel, you can choose to set most common monitoring checks on your servers. This article explains these common check and the options that you can set for them on Cloud Control Panel. For information about setting up one of these monitoring checks, see Create a monitoring check using the Cloud Control Panel.
All other Rackspace Monitoring checks
For configuration of all the supported checks and plugin checks, suppressions, notification plans, see Rackspace Intelligence documentation.
For complete list of checks you can create with Rackspace Monioring, see Rackspace Monitoring checks and alarms.
Available monitoring checks through Cloud Control Panel for Cloud Servers
Monitoring checks and alarms are located in the Cloud Servers section of the Cloud Control Panel.
- You can create a check by clicking the gear icon next to your individual server name and selecting Create Check.
- To edit a check, click on the server name and scroll to the Monitoring Checks section of the server details page. From there, you can click a check name and make changes to it.
HTTP
When you create an HTTP check, you can set the URL and specific body context with regular expressions allowed. Click Advanced Options to open a Body Match text box in which you can provide more syntax.
You can edit the following options for an existing HTTP check:
- Target: Specify the server IP address or a specified host name.
- Details: Specify the exact URL and body content to use. Regular expressions are allowed.
- Parameters: Set how often the check runs and when it will time out, as well as which regions the check uses.
- Alarms: Edit existing alarms or click Create Alarm to add an alarm
TCP
When you create a TCP check, you can set the port that you want to monitor for connectivity. Provide the following information:
- Port number
- Target IP address or target host name
You can edit the following options for an existing TCP check:
- Target: Specify the server IP address or a specified host name.
- Details: Specify the port to be monitored.
- Parameters: Set how often the check will run and when it will time out.
- Alarms: Edit existing alarms or click Create Alarm to add an alarm.
Ping
When you create a Ping check, you can select a name and select the target type as IP address or host name.
You can edit the following options for an existing Ping check:
- Details: Set the packet count and the number of packets that are sent at one time.
- Parameters: Set how often the check runs and when it will time out, as well as which regions the check will use.
- Alarms: Edit existing alarms or click Create Alarm to add an alarm.
Memory
There are no special settings when you create a Memory check.
You can edit the following options for an existing Memory check:
- Parameters: Set how often the check will run and when it will time out.
- Alarms: Edit existing alarms or click Create Alarm to add an alarm.
CPU
There are no special settings with you create a CPU check.
You can edit the following options for an existing CPU check:
- Parameters: Set how often the check runs and when it will time out.
- Alarms: Edit existing alarms or click Create Alarm to add an alarm.
Load Average
There are no special settings when you create a Load Average check.
You can edit the following options for an existing Load Average check:
- Parameters: Set how often the check runs and when it will time out.
- Alarms: Edit existing alarms or click Create Alarm to add an alarm.
Filesystem
When you create a Filesystem check, you can specify the disk for which you want to monitor space.
You can edit the following options for an existing Filesystem check:
- Parameters: Set how often the check runs and when it will time out.
- Alarms: Edit existing alarms or click Create Alarm to add an alarm.
Network
When you create a Network check, you set the following options:
- Select which network interface to use (typically eth0 or eth1).
- Set the receive rate alert for warning and critical states.
- Set the transmit rate alert for warning and critical states. (For more information, see Rackspace Monitoring Checks and Alarms.)
You can edit the following options for an existing Network check:
- Parameters: Set how often the check runs and when it will time out.
- Alarms: Edit existing alarms or click Create Alarm to add an alarm.
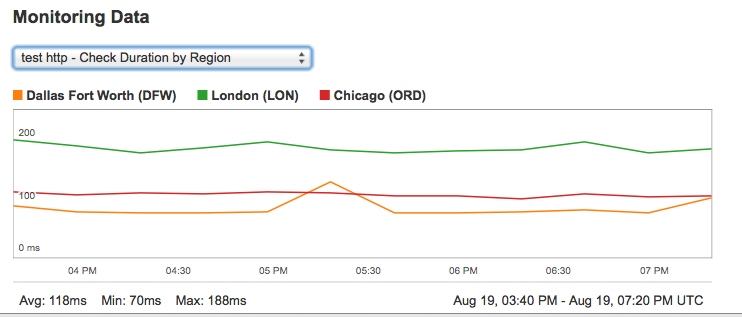
Data graphs for monitoring
You can view graphical information about resource use on the server details page. In the Monitoring Data section of the page, you can view historical check data. This viewing option is available for all checks and does not require the monitoring agent to be installed. Use the drop-down menu to select the monitoring check that you want to view.
Updated about 2 months ago