Use Rackspace Monitoring on Mobile Devices
The Rackspace Cloud mobile application for iOS® and Android® devices allows you to monitor your cloud infrastructure's health instantly. The Rackspace Cloud mobile app, when used with Rackspace Monitoring, provides you with timely and accurate information about how your resources are performing.
This article describes how to get started with the app and to perform the following Rackspace Monitoring actions on your mobile device:
- View the status of any current alarm
- View historical data and graphs that show trends over time
- View monitoring check and alarm details
- Understand error conditions
Get started
If you haven't already done so, install Rackspace Monitoring on your cloud resources. For information about setting up monitoring by using the Cloud Control Panel or the Rackspace Monitoring API, see Getting Started With Rackspace Monitoring.
Open the monitoring screen
On the application's main menu on your device, tap Monitoring. A number on the main menu, as shown in the following example, indicates that you have one or more resources with an alarm in a critical or warning state.
On the Monitoring home screen, you can view a list of monitored resources and their current status. By tapping the different status icons, you can view resources with at least one alarm in Critical, Warning, or OK state.
- Alarms in a Critical state display in red.
- Alarms in a Warning state display in yellow.
- Alarms in OK state display as green.
- Alarms with an error or unknown state display in grey.
If a resource has multiple alarms with different states (for example, one critical alarm and one warning alarm), the resource appears, by default, on the status tab of the most critical state.
View monitoring details
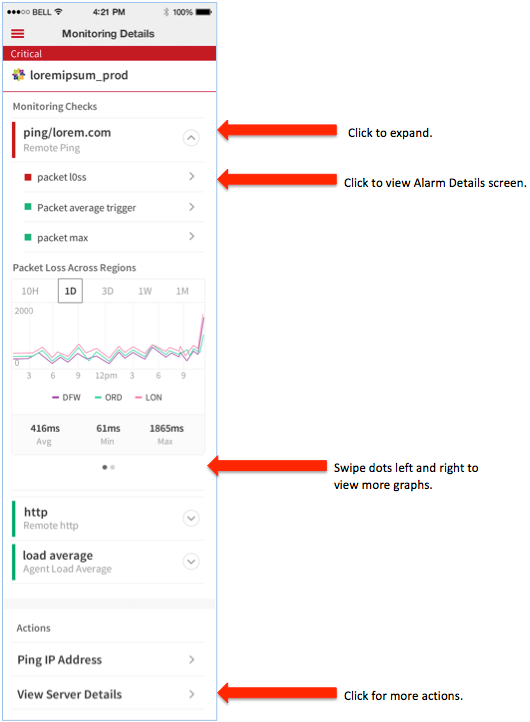
If you tap a resource, you can see the monitoring checks, the alarm status of each check, and a graph showing data over time.
In the following example, the Remote Ping check has a problem. Click on the check to expand the view and see a graph of data over time. You can swipe to view multiple graphs.

View errors
The grey-highlighted monitored resources might have an error. You can diagnose errors with checks by visiting the Cloud Control Panel (for Cloud Servers) or by using the Rackspace Monitoring API (for all other resources).
View resources with No Status Available
If your monitored resource is grey, it might have no status. A resource can have no status for the following reasons:
- You have disabled all alarms.
- You have deleted all alarms.
When you have configured no alarms, there are no thresholds to trigger a change in the state of the alarms, and the app cannot deliver a status for that resource. You can configure alarms for Cloud Servers in the Cloud Control Panel. To configure alarms for all other resources, use the Monitoring API. For information about how to use the API, see the Rackspace Monitoring Developer Guide.
Monitor Cloud Databases
Cloud Databases are provisioned with six default checks and one alarm. Cloud Database users can view metrics and graphs for all checks except the MySQL check.
The preconfigured alarm provides warning and critical thresholds for low disk space only. For this reason, the status bar on any MySQL instance shows a green status whenever the disk space is within the threshold. There is no status change if other checks are high or low because you have set no alarms or thresholds.
You can configure additional alarms and notification plans by using the Cloud Databases API. For more information, see the Monitoring Cloud Databases section in the Cloud Databases Developer Guide. At this time, Cloud Database users cannot configure additional checks.
Updated 5 months ago