
Rackspace VM Management for Private Cloud
- Introduction
- Getting Started
- Features and Functionality
- Security and Compliance
- Service Level Agreements
- Billing and Payments
- Support and Troubleshooting
- Terms of Service
- Privacy Policy
- Feedback and Suggestions
Introduction
VM Management is an add-on service that leverages a set of automation processes and tools to enable traditional hosting style services such as (1) OS administration, (2) monitoring, (3) patching, and (4) Host Protection services for the operating systems of customer selected guest VMs that have been created in or migrated to the private cloud. The purpose of this handbook is to provide our customers with the information they need to extract value from the platform and achieve the desired outcomes.
Getting Started
Pricing
Pricing for each service can be found at the following location. [Pricing]
Prerequisites
Before proceeding, verify that you have the necessary resources to complete integration between your cloud and Rackspace.
Review the following list of prerequisites:
- You have administrator access to your Rackspace Customer Portal.
- You have any necessary permissions at your company.
- You have administrator access at your cloud provider.
- Your VM operating system is on the compatibility list. Windows | Linux
- The following software is required on each server where the SSM Agent will be installed:
o Linux - curl and/or wget, python3 or python
o Windows - PowerShell v3 or greater
Network Connectivity Requirements(Egress):
| Endpoint | Description |
|---|---|
| https://ssm.REGION.amazonaws.com | Access to the core Systems Manager API endpoints |
| https://ssmmessages.REGION.amazonaws.com | Access to API operations for AWS Session Manager |
| https://ec2messages.REGION.amazonaws.com | Access to API operations for Amazon Message Delivery Service |
| https://s3.amazonaws.com | Access to S3 for installation binaries |
| https://s3.REGION.amazonaws.com https://s3-REGION.amazonaws.com https://*.s3.REGION.amazonaws.com | Access to S3 APIs used to log Systems Manager operations |
| https://amazon-ssm-REGION.s3.amazonaws.com | Hosts the Systems Manager Agent installer |
| https://add-ons.api.manage.rackspace.com | This endpoint manages the deployment of agents to supported devices and triggers enrollment into various services (e.g.Passport) |
| https://add-ons.manage.rackspace.com | This endpoint hosts automation scripts that are used during the device enrollment process. |
| https://logs.REGION.amazonaws.com | Storing SSM agent logs for commands run on a server |
| https://kms.REGION.amazonaws.com | Enabling KMS encryption for AWS Sessions Manager |
In order to determine the region for the above follow the table below:
| Rackspace DC/VCD* | AWS Region |
|---|---|
| ORD | us-east-2 |
| IAD | us-east-1 |
| DFW | us-west-2 |
| SYD | ap-southeast-2 |
| HKG | ap-southeast-1 |
| LON | eu-west-2 |
| STO | eu-north-1 |
| SJC3 | us-west-2 |
| us1.rsvc.rackspace.com | us-east-1 |
| us2.rsvc.rackspace.com | us-east-1 |
| gb1.rsvc.rackspace.com | eu-west-2 |
| gb2.rsvc.rackspace.com | eu-west-2 |
| de1.rsvc.rackspace.com | eu-central-1 |
Datadog Network Connectivity Requirements (Egress):
| Endpoint | Description |
|---|---|
| agent.datadoghq.com | |
| yum.datadoghq.com | |
| install.datadoghq.com | |
| keys.datadoghq.com | |
| apt.datadoghq.com | |
| process.datadoghq.com | |
| intake.synthetics.datadoghq.com | |
| intake.synthetics.datadoghq.com | |
| intake-v2.synthetics.datadoghq.com | |
| api.datadoghq.com | |
| config.datadoghq.com | |
| dbm-metrics-intake.datadoghq.com | |
| dbquery-intake.datadoghq.com | |
| browser-intake-datadoghq.com | |
| agent-intake.logs.datadoghq.com | |
| tcp-encrypted-intake.logs.datadoghq.com | |
| gcp-encrypted-intake.logs.datadoghq.com | |
| http-encrypted-intake.logs.datadoghq.com | |
| agent-http-intake.logs.datadoghq.com | |
| <<VERSION>>-flare.agent.datadoghq.com | The endpoints listed are for the Datadog Monitoring Agent communication. |
| ddagent-windows-stable.s3.amazonaws.com | Binary for Datadog Agent installation |
Traffic is always initiated by the Agent to Datadog. No sessions are ever initiated from Datadog back to the Agent. All Agent traffic is sent over SSL. The destination is dependent on the Datadog service and site. To see destinations based on your Datadog site, click the DATADOG SITE selector on the right.
For additional reading, please refer to https://docs.datadoghq.com/agent/configuration/network/
Service Enrollment
SDDC Portfolio
The SDDC portfolio of products comes ready for device enrollment. This can be achieved by logging into the customer portal and following the add-on enrollment section in this guide.
Public Cloud
If you are a public cloud customer looking to use VM Management on devices within that environment, please contact your sales executive for more information.
VMC on AWS
If you are a VMC on AWS customer looking to use VM Management on devices within that environment, please contact your sales executive for more information.
Agent Installation
Rackspace Provided Images
Rackspace-provided images come with the agent preinstalled. If you still see the ‘Agent Installation’ warning within the Resource UI then run the scripts found in the next section, titled ‘Customer Provided Images on VMware based platforms.’
Customer Provided Images on VMware based platforms
To utilize VMM on a non-Rackspace image, install the Rackspace Agent on the VM or where the Agent is not installed.
The following install scripts should be run on each VM that has been created with the custom image that was imported.
Script (Linux): https://add-ons.manage.rackspace.com/scripts/v2/agent/bootstrap.py
Script (Windows): https://add-ons.manage.rackspace.com/scripts/v2/agent/bootstrap.ps1
Add-On Enrollment
- From the My Accounts page, click on “My Accounts” drop-down on the left side of the page.
- Select, “My Resources” to open the Resource UI
- The Resource UI will show all the virtual machines currently located in your environment.
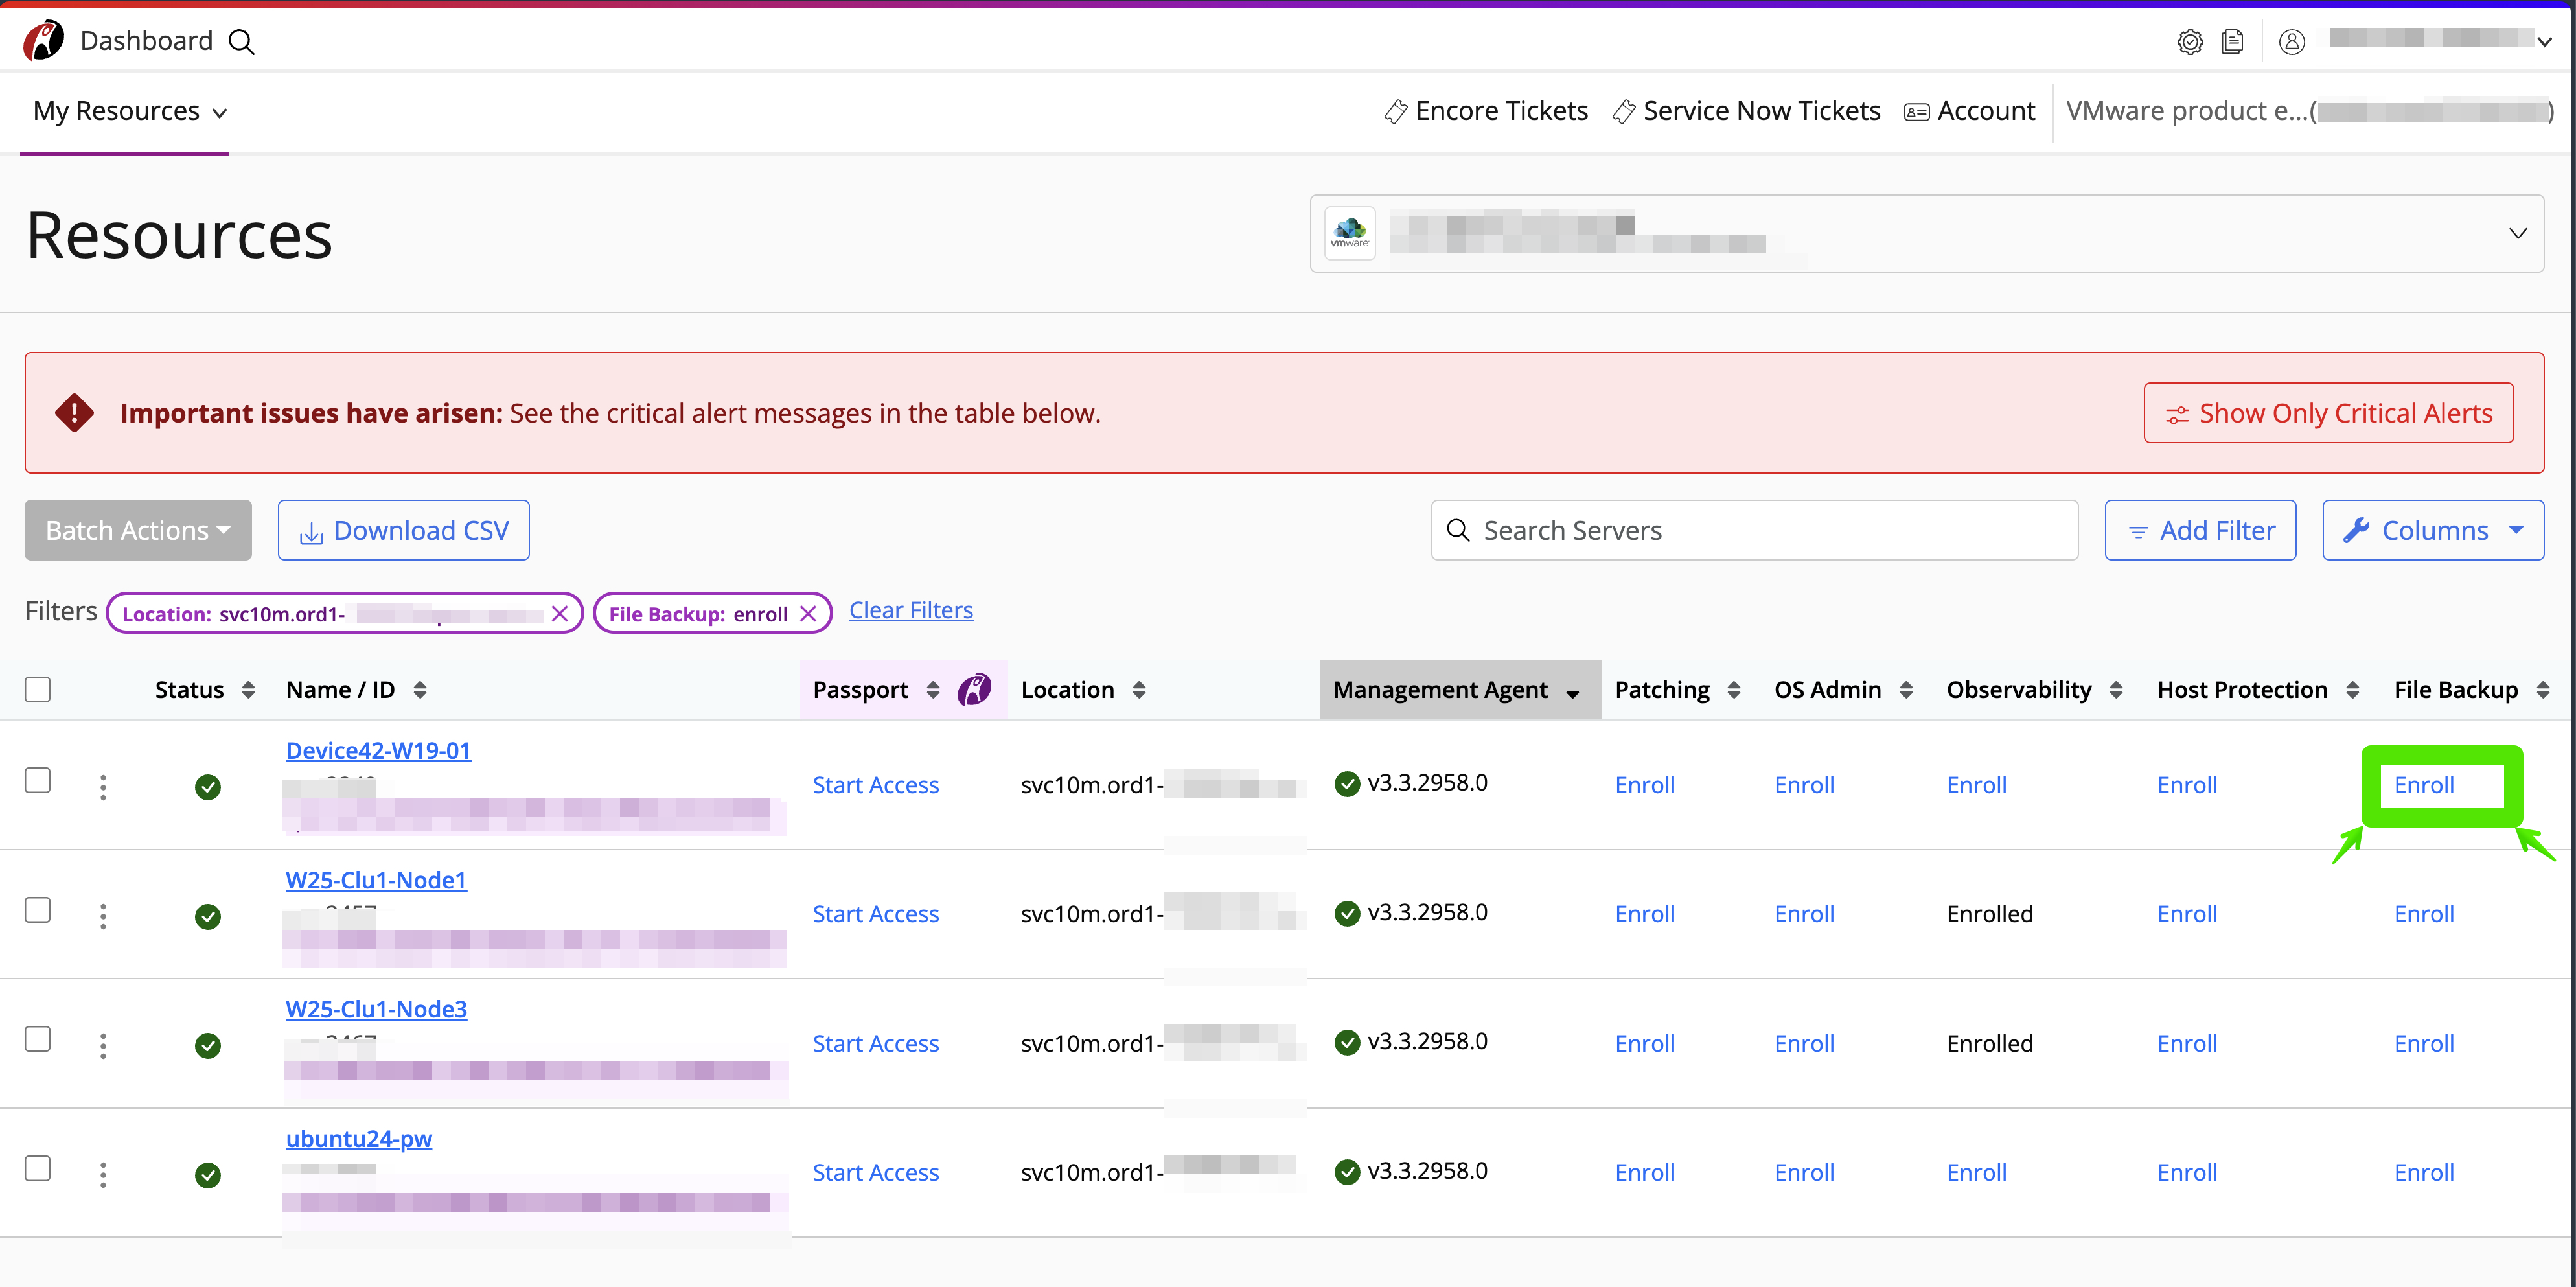
If the VM does not have the option to “Enroll” in a feature. This is most likely due to a missing agent and would be evidenced by the ‘Management Agent’ column showing ‘Agent Installation’ as seen below. The instructions to resolve this issue can be found in the Agent Installation section of this handbook.
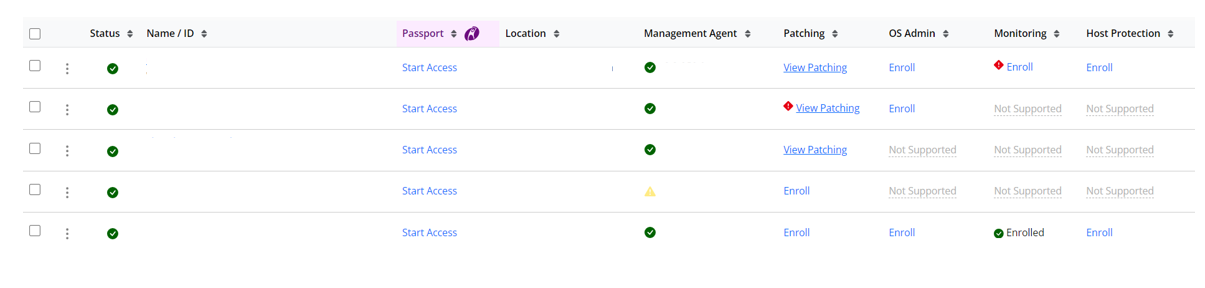
- To enroll a VM in service, click the Enroll button in the corresponding VMM Add-On column.
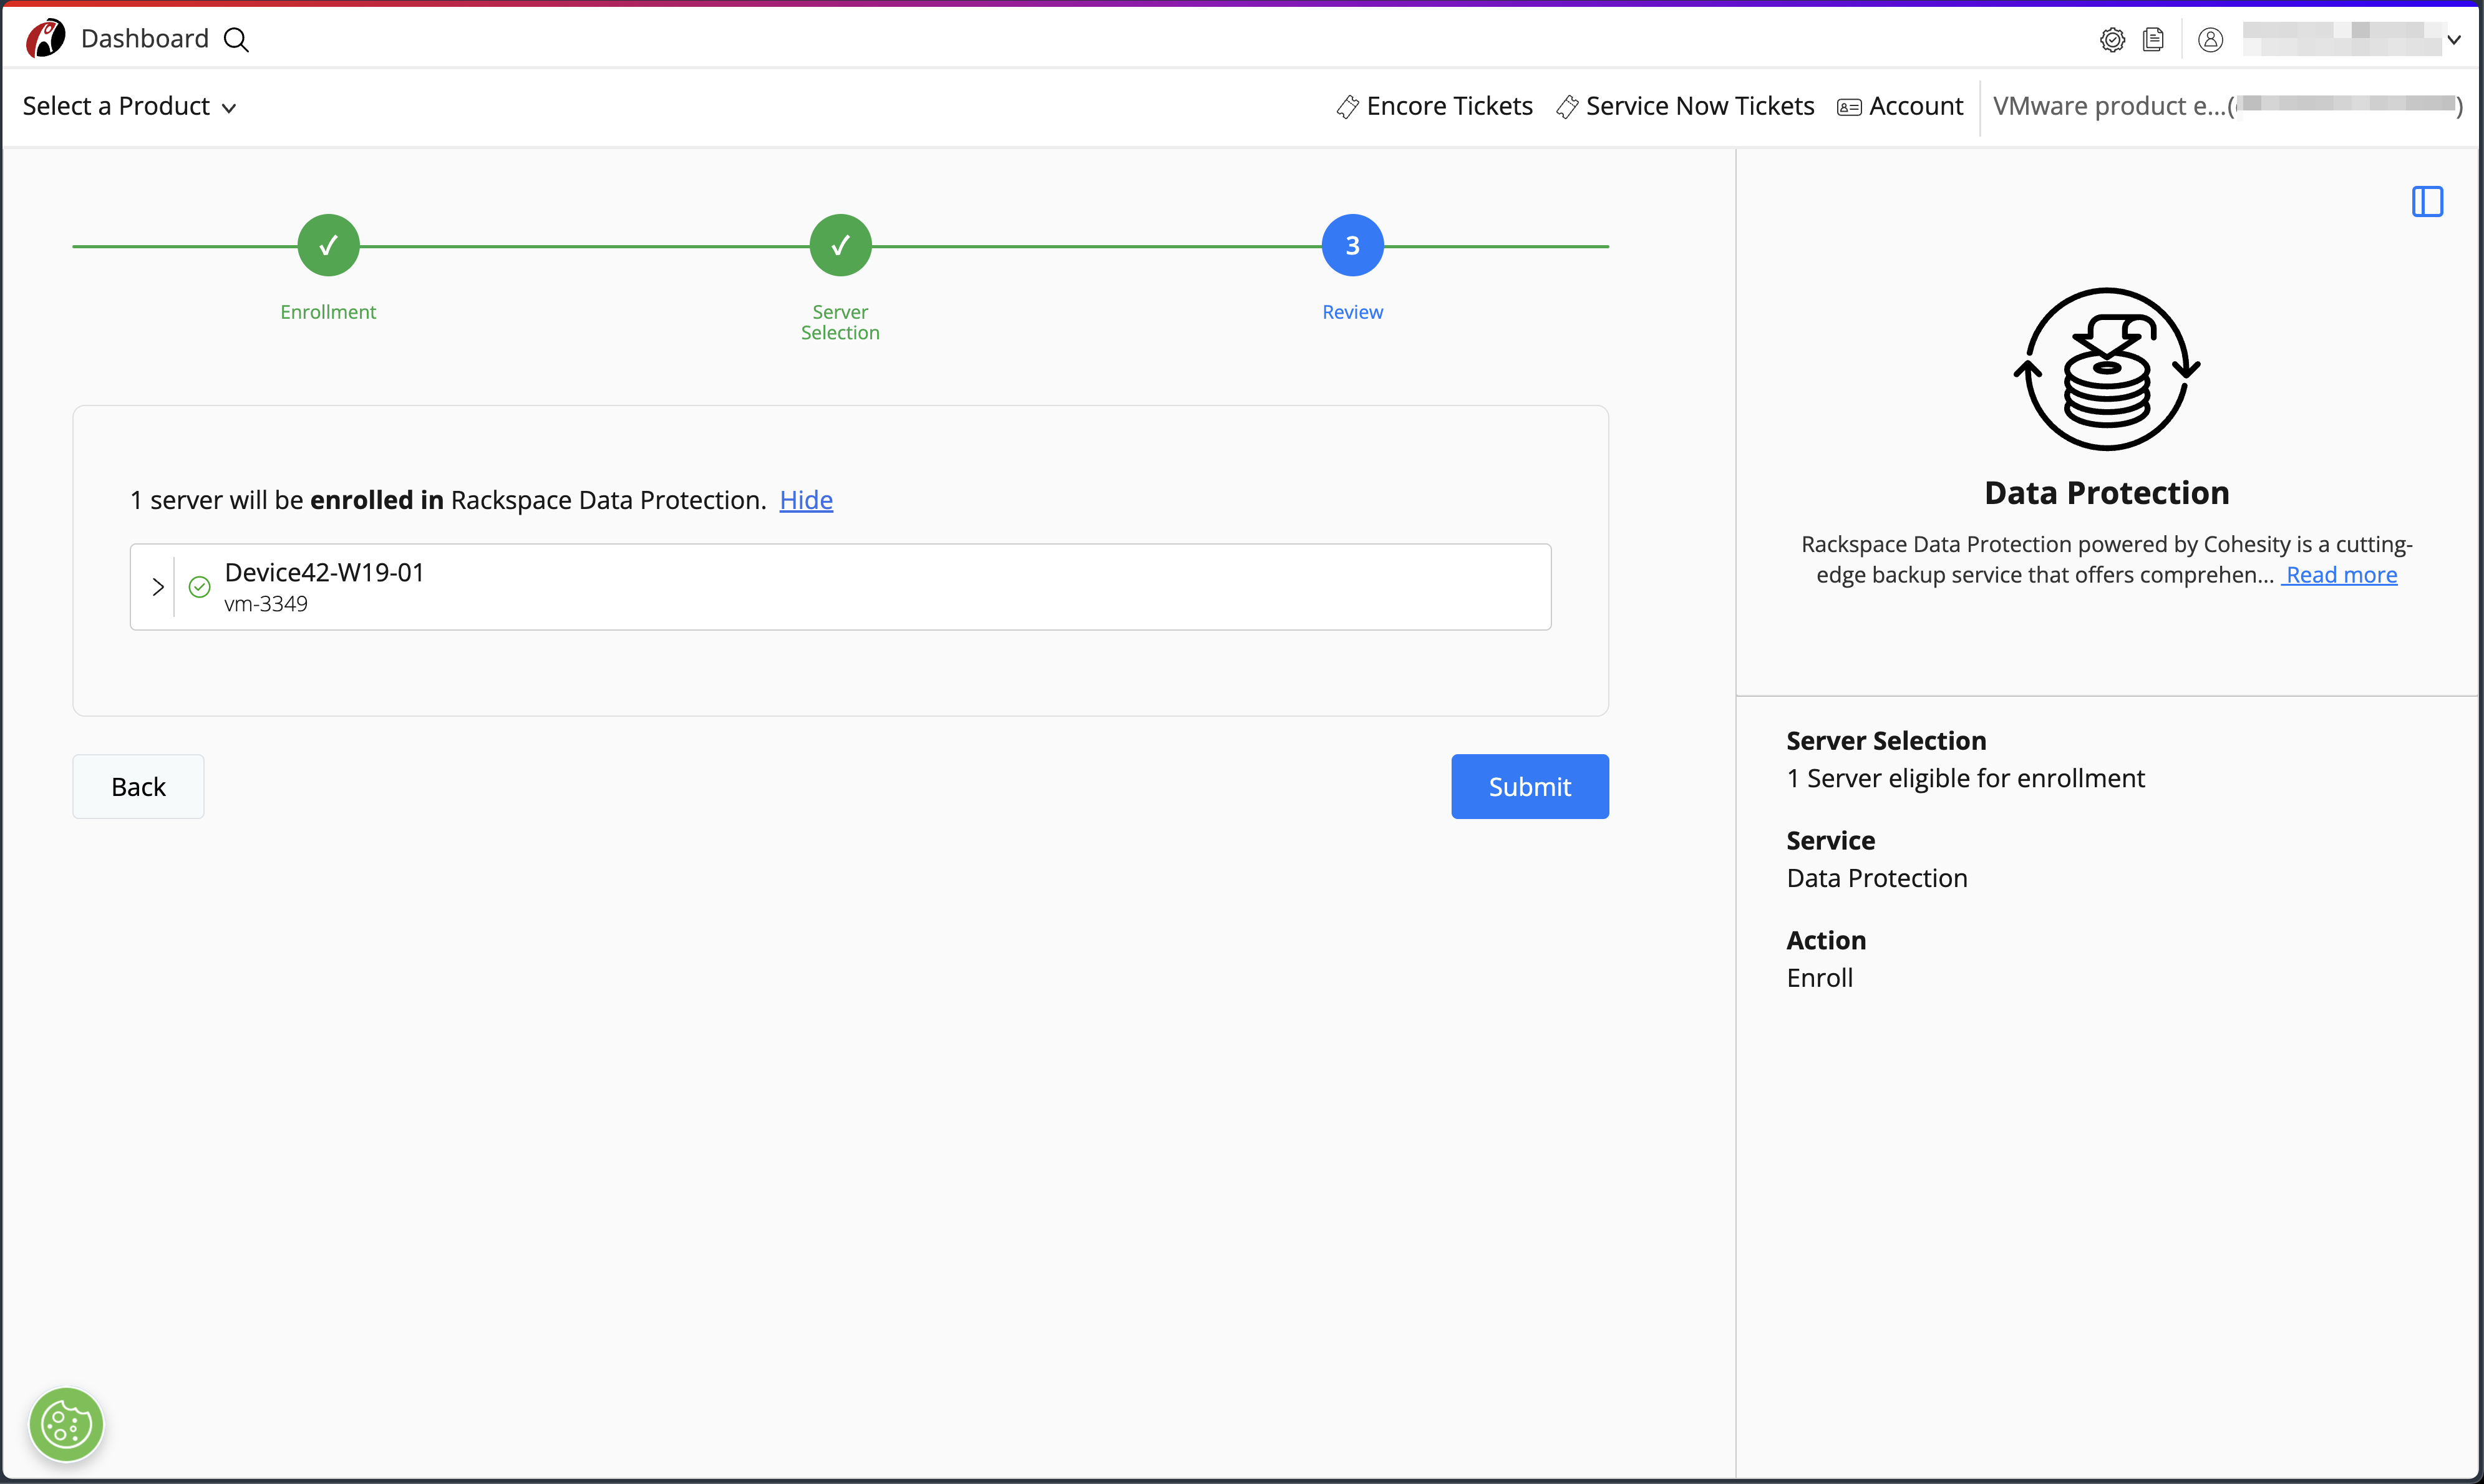
- This will bring up the enrollment confirmation screen.
From there Click the Enroll Server button.
- This process is the same for OS Admin, Monitoring, and Host Protection.
- For patching you will need to click “Enroll Server”
- And select a Patching group, that corresponds with your needed patch window and OS.
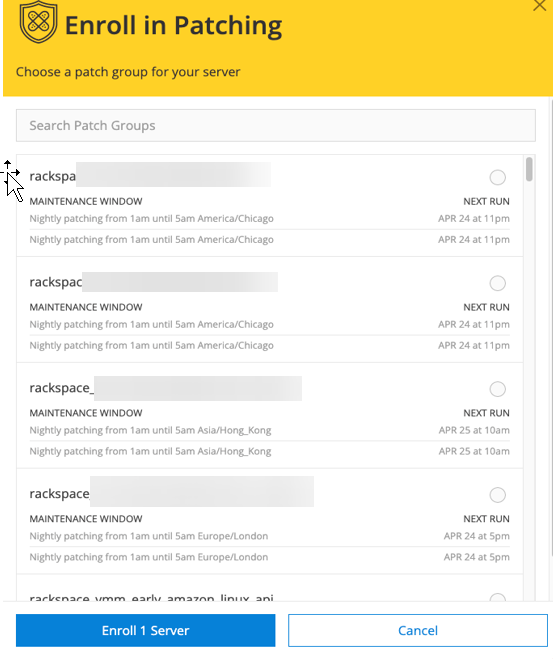
The field titled: ‘next run’ is given in local server time.
Patching UI
If you’re enrolled into patching specifically you will get access to the ‘Patching UI’ and it can be found by navigating on the top left of the customer portal and selecting ‘Patching’ as seen below:
Within this portal you will have several different views to choose from, allowing you to take different actions and export reporting data from that section. The sections are:
- Patch Groups
- Instances
- Maintenance Windows
Within the ‘Patch Groups’ you’re able to see the way your instances are grouped and then assigned to various maintenance windows. Here you will also see instance status, pending updates, baselines etc. all at the group level.
Within the ‘Instances’ section you can select individual instances to drill down into updates at that level. The information here ranges from missing KBs to updates about the last run. This view can be seen below:
In the ‘Maintenance Windows’ section you’re able to see the existing maintenance groups, their schedules, next run and more. That view is previewed below:
The portal experience is primarily self-service and as such there are many options which can be toggled in all of the above windows. For any activities that you do not want to take through self-service you’re able to put a ticket in and Rackspace engineers would be more than happy to assist.
Unenrollment
For devices being decommissioned or already decommissioned, ensure that they are in powered on state, before proceeding with the Services unenrollment.
- To unenroll, open the resource UI.
- Click on the icon next to the VM you want to unenroll.
- Click “Unenroll from” followed by the name of the service you would like to remove. “IE Unenroll From OS Admin”
Features and Functionality
This section provides information about each of the following areas of the VM Management experience.
-
Managed OS Administration.
-
Managed OS Patching
-
Managed OS Monitoring
-
Host Protection
-
Data Protection
Managed OS Administration
When a VM is enrolled in OS Administration, Rackspace Technology creates a configuration management database (CMDB) record of the VM, and securely stores Customer- provided OS login credentials so that our OS system administrators can log in to the OS and perform the desired OS Services upon request.
This service enables a customer to initiate a request that would trigger a Rackspace administrator to log in to the guest OS of a virtual machine in the private cloud. Rackspace support engineers will utilize secure, time-limited, and audited access to the environment to provide troubleshooting services for supported systems.
Spheres of Support
OS Administration spheres of support can be found here:
Managed OS Patching
Rackspace Technology provides a managed OS patching service for supported operating systems. The patching schedule is set by the Customer and Rackspace Technology configures the guest OS to use Rackspace Technology-provided patching sources so that only approved patches are delivered and installed on customer machines.
Managed OS Monitoring
Cloudwatch Monitoring
Rackspace Technology installs, configures, and responds to monitoring alerts from an installed OS agent for OS and application alerts and conditions on VMs. It enables monitoring of guest OS service availability on a network, internal OS system resources, OS services operational status, and error conditions.
The default monitoring thresholds are as follows;
Windows
Windows metrics are located in the System/Window CW metric namespace
Linux
Linux metrics are located in the System/Linux CW metric namespace
Notes:
CPU, Memory, and Disk Percent alarms are configured to trigger when the given metric exceeds the threshold for 6 consecutive 5-minute averages. They are configured to clear when any subsequent 5-minute average of the metric is below the threshold.
- The Disk Free Space alarm is configured to trigger when the given metric falls below the threshold for 5 consecutive 1-minute averages. It is configured to clear when any subsequent 1-minute average of the metric is above the threshold.
- Disk alarms are NOT created for the following volume file system types:
- devtmpfs
- tmpfs
- devfs
- rootfs
- squashfs
- overlay
- Disk alarms are NOT created for Kubernetes container volumes: any volume path starting with “/var/lib/kubelet/”.
Advanced Monitoring - Observability
This section will provide insights into Advanced Monitoring - Observability and dive deep into the context of Rackspace Services for Datadog. This partnership enables Rackspace Technology to leverage the Datadog platform to provide a suite of observability services to diagnose problems in customers' environments and minimize the impact of business-disrupting events on customers’ operations.
What is Observability
About Datadog
Datadog is the monitoring and security platform for infrastructure and applications. The SaaS platform integrates and automates infrastructure monitoring, application performance monitoring and log management to provide unified, real-time observability of our customers’ entire technology stack. Datadog is used by organizations of all sizes and across a wide range of industries to enable digital transformation, drive collaboration among development, operations, security and business teams, accelerate time to market for applications, reduce Mean Time to Repair.
Datadog Integrations
An integration, at the highest level, is when you assemble a unified system from units that are usually considered separately. At Datadog, you can use integrations to bring together all of the metrics and logs from your infrastructure and gain insight into the unified system as a whole—you can see pieces individually and also how individual pieces are impacting the whole. Datadog supports more than 700 built-in integrations across different systems, applications, and services.
Additional details about Datadog integrations can be found here -> Integrations (datadoghq.com)
How is Rackspace using Advanced Monitoring - Observability?
Rackspace is a top tier GOLD Partner with Datadog globally
- Resell Partner
- Managed Services Provider
- System Integration and Professional Services
Rackspace is integrating Datadog into our overall VMM offering in terms of Observability. The following attributes are enabled by default for any customer enrolled in Advanced Monitoring - Observability.
- Default host metrics provided by Datadog
- Live process monitoring
- Log collection enabled with system event logs configured by default
What is included in Advanced Observability Monitoring?
Rackspace will leverage Advanced Monitoring - Observability to monitor the following components:
- CDM (CPU, Disk, and Memory) monitoring
CDM Monitoring Thresholds
CPU
Linux: Composite monitor (combination) - CPU utilization: > 95% based on cpu.idle < 5 and CPU load average: > 4 based on system.load.norm.1 (load average normalized per core over 1 minute)
Windows: Composite monitor (combination) - CPU utilization: > 95% based on cpu.idle < 5 and Proc Queue Length avg > 10 based on system.proc.queue_length
Memory
Windows: Composite monitor (combination) - Memory utilization: > 95% and Anomaly - Page reads/sec: 3 deviations outside of normal range for 15 minutes
Anomaly Query: avg(last_4h):anomalies(avg:Win_mem_page_reads_sec{*} by {host}, 'agile', 3, direction='above', interval=60, alert_window='last_15m', timezone='utc', count_default_zero='true', seasonality='hourly') >= 1
Linux: Composite monitor (combination) - Memory utilization: > 95% and Anomaly – Swap out: 3 deviations outside of normal range for 15 minutes
Anomaly Query: avg(last_4h):anomalies(avg:system.swap.swap_out{*} by {host}, 'agile', 3, direction='above', interval=60, alert_window='last_15m', timezone='utc', seasonality='hourly', count_default_zero='true') >= 1
Disk
Root Disk: Threshold monitor < 1024 MB
Non-Root Disk: Threshold monitor > 99%
Datadog Portal Login
This section describes how to federate from Rackspace Fabric to Datadog portal to locate a specific host.
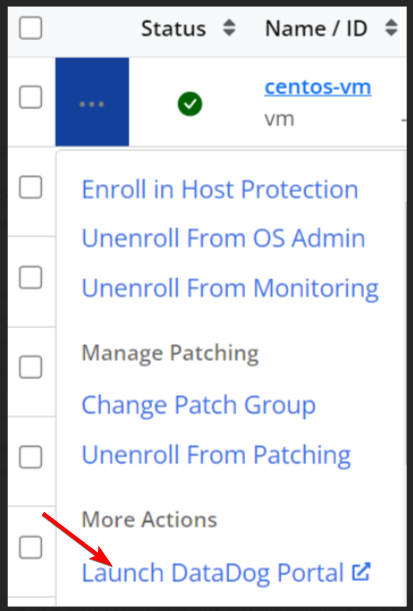
- To access the Datadog portal for the account, navigate to a device in https://manage.rackspace.com → search for the Account name→ My resources→ select a resource, click the 3 dots next to a server, and select "Launch Datadog Portal."
- You will be sent to the Datadog "Dashboards" section. This is where you can create dashboards consisting of information from the default configuration and the additional integrations configured on the servers.
Find more information on configuration Dashboards at Getting Started with Dashboards (datadoghq.com)
Datadog Dashboard Overview
Dashboards provide real-time insights into the performance, historical insights and health of systems and applications within an organization. With dashboards, teams can identify anomalies, prioritize issues, proactively detect problems, diagnose root causes, and ensure that reliability goals are met.
Datadog Portal also can get an instant view of the processes running on a VM and the resources those processes are taking up which will allow you to analyze data from across your entire system in a single pane of glass.
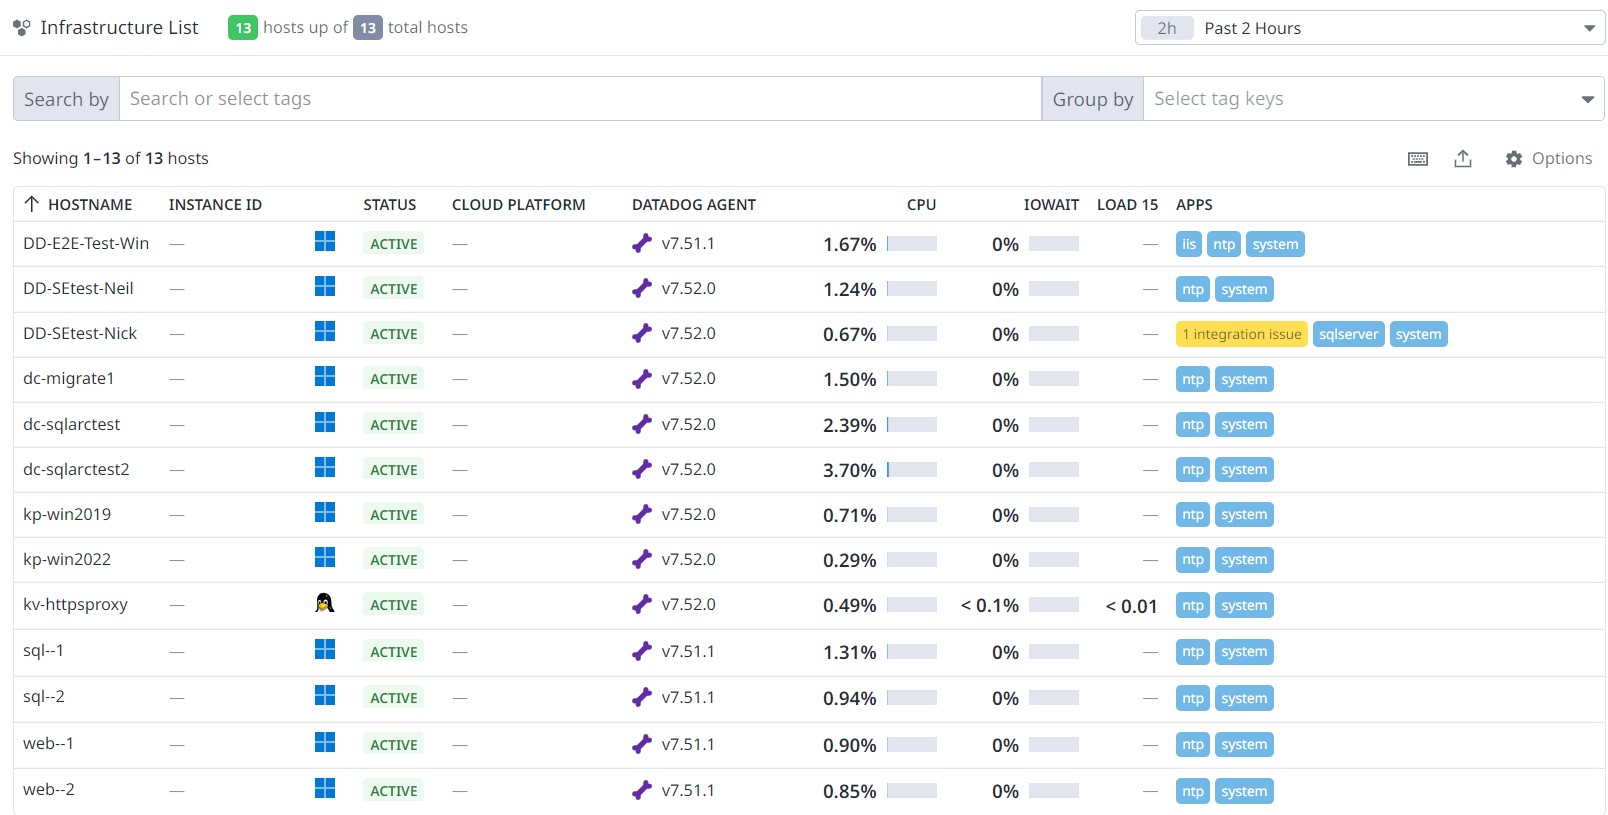
To get a list of all devices configured with Datadog monitoring for the account click on Infrastructure once you federate into the Datadog Portal
- You will see a list of devices and the "Apps" configured for the servers.
- Clicking on a server will pull up more information on the server including.
- The agent configuration
- The server metrics
- Running processes
- Server logs
- To see more detailed information on a device, click the "Open Host Dashboard" on the top right of the pop out screen.
- This will take you to a more detailed dashboard for the individual server.
- Alerting is configured in the "Monitors" section. A default list of monitors will be configured for all hosts within Datadog.
- A list of enabled Integrations on the account can be found in the "Integrations" section.
- These can be "Installed" but most of them will require additional configuration on the server.
- Please see Introduction to Integrations (datadoghq.com) for additional configuration information for integrations
- These can be "Installed" but most of them will require additional configuration on the server.
Infrastructure
Infrastructure monitoring includes core Datadog features that visualize, monitor, and measure the performance of your hosts, containers, and processes.
Host Map
The host map can be found under the infrastructure menu. It offers the ability to:
- Quickly visualize your environment
- Identify outliers
- Detect usage patterns
- Optimize resources
Hosts
The following information is displayed in the infrastructure list for your hosts:
Hostname
The preferred hostname alias (use the Options menu to view Cloud Name or Instance ID).
Cloud Name
A hostname alias.
Instance ID
A hostname alias.
Status
Displays ACTIVE when the expected metrics are received and displays INACTIVE if no metrics are received.
CPU
The percent of CPU used (everything but idle).
IOWait
The percent of CPU spent waiting on the IO (not reported for all platforms).
Load 15
The system load over the last 15 minutes.
Apps
The Datadog integrations reporting metrics for the host.
Operating System
The tracked operating system.
Cloud Platform
Cloud platform the host is running on (for example, AWS, Google Cloud, or Azure).
Datadog Agent
Agent version that is collecting data on the host.
Monitors
With Datadog alerting, you have the ability to create monitors that actively check metrics, integration availability, network endpoints, and more. Use monitors to draw attention to the systems that require observation, inspection, and intervention. A metric monitor provides alerts and notifications if a specific metric is above or below a certain threshold. For example, a metric monitor can alert you when disk space is low.
Create a Monitor
To create a monitor, navigate to Monitors > New Monitor > Metric.
- Detection method: How are you measuring what will be alerted on? Are you concerned about a metric value crossing a threshold, a change in a value crossing a threshold, an anomalous value, or something else?
- Define the metric: What value are you monitoring to alert? The disk space in your system? The number of errors encountered for logins?
- Alert conditions: When does an engineer need to be woken up?
- Notification: What information needs to be in the alert?
Datadog Integration Enablement
Enabling Datadog integrations on a server allows customers to collect metrics/logs for different applications or services on the server (IIS, Apache, MSSQL, etc.). When an integration is enabled, a default set of metrics are gathered and a default set of monitor(s) will be enabled. Certain integrations will have requirements before installing but those will be indicated. The only requirement up front is that the server(s) is enrolled in Datadog and has the agent currently installed.
In order to provide a self-serve experience, Rackspace has created automation to enable specific integrations on servers and has exposed this capability to customers, using the service catalogue.
Enabling integration via Service Catalogue
- To begin, navigate to Manage Enrollments.
- Select the third option to Configure Existing Enrollment and select the service Observability. Continue.
- Select the servers that you wish to enable the integration on. Continue.
- Select the integration you wish to add and click Add Integration
- On the next screen you can choose to Add
nameIntegration to all the selected servers, or simply Add to individual servers.
- On the next screen you can choose to Add
- After you Save, you'll be able to review and Submit the enrollment.
- Once complete, you'll be able to view installed integrations in the Resource UI by hovering over the Enrolled label under Observability
Removing integrations via Service Catalogue
- To unenroll/remove an integration, start by repeating steps 1-3 above.
- Select Manage Integration
- Select Remove from the servers you wish to remove the integration from and Save
- Review and Submit the task. This will remove the integration configuration file from the server which will stop the metrics for that integrations from being sent to Datadog and will reflect in the Datadog portal.
Integrations
This section will detail the specific integrations that can be enabled via Service Catalogue, as they get released by Product. The default metrics being gathered from each integration are available in their associated Datadog documentation. The default monitors that are deployed via automation will be listed under the integration and can be viewed in the Datadog portal under Monitors
IIS (Windows)
- Default metrics: IIS (Datadog documentation)
- Default monitor(s):
- IIS App Pool Up: iis.app_pool_up service check. Returns
CRITICALif the tagged app_pool is down andOKotherwise.
Apache (Linux)
- Default metrics: Apache (Datadog documentation) NOTE: In order for the metrics to be gathered by the Datadog agent, the config file must indicate the status url of your Apache server, done by enabling the Apache mod status. By default, this is set to
apache_status_url: [http://localhost/server-status?autoand will be configured during the automated deployment. If this differs from your Apache installation, you can request, via ticket, to change the status url so Apache metrics can be successfully sent to Datadog. - Default monitor(s):
- Apache Can Connect Monitor: apache.can_connect service check. Returns
CRITICALif the Agent is unable to connect to the monitored Apache instance. ReturnsOKotherwise.
- Apache Can Connect Monitor: apache.can_connect service check. Returns
MSSQL (Windows)
Prerequisite: This integration utilizes the Windows Authentication method in SQL Server and requires that the local Datadog agent user has been granted the following permissions on the SQL Server so it can gather SQL Server metrics and report them to Datadog. During enrollment, a pre-check is run to confirm these permissions exists and will fail if they are not available.
- Local ddagentuser as sql login for Windows Authenticaion. Required SQL Server Permissions granted:
-
CONNECT ANY DATABASE
CONNECT SQL
VIEW ANY DATABASE
VIEW ANY DEFINITION
VIEW SERVER STATE
-
-
Default metrics: MSSQL (Datadog documentation)
-
Default monitors:
- SQL Server Instance Offline:
sqlserver.can_connectservice check. ReturnsCRITICALif the agent is unable to connect to the monitored SQL Server instance. ReturnsOKotherwise. - Database is Offline: Checks the metric
sqlserver.database.stateand will trigger an alert for a value greater than 0 - Availability Group Sync Unhealthy (AOAG): Checks the metric
sqlserver.ao.ag_sync_healthwhich reflects a rollup of the synchronization health of all availability replicas in the availability group and will trigger for a value less than 2 - Replica Failover Readiness (AOAG): Checks the metric
sqlserver.ao.replica_failover_readiness, which indicates whether the secondary database is synchronized with the corresponding primary database in the respective availability group, and will trigger for a value less than 1
- SQL Server Instance Offline:
Tagging
Using tags enables you to observe aggregate performance across several hosts and narrow the set further based on specific elements. In summary, tagging is a method to observe aggregate data points.
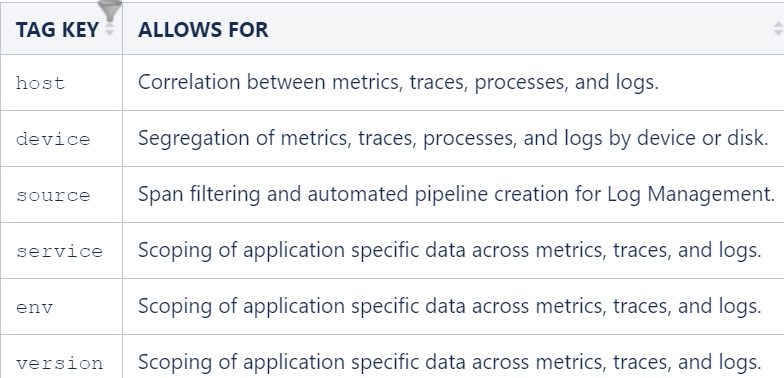
For further reading on how to assign and use tags.
Datadog customer API Key
API keys are unique to your organization. An API key is required by the Datadog Agent to submit metrics and events to Datadog.
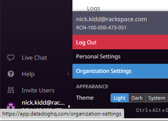
- Should you need to locate the API Key for any reason you can do so by hovering over your name on the bottom left and selecting "Organization Settings"
- Go to the "API Keys" Section, hover over the key and click the Copy Key button on the far right when it appears.
Host Protection
Rackspace Technology installs an OS antivirus agent on the selected VMs to provide Customers with Host Protection services.
Host Protection service has the following key features.
Automated Agent Deployment
Customers have the flexibility to scale up or down resources, and protect the hosts at any given point, by enrolling the Host Protection service.
Next Gen Antivirus Protection
Rackspace Technology configures the industry standard threat protection policy, which protects from known malware and keep your organization secure from file-less attacks and zero-day exploits by leveraging AI with deep learning to evaluate files before they run.
Real-time Scanning & Run-time Protection
It is the primary feature of Host Protection which uses different scanning mechanisms e.g. Reputation Scan, Deep Learning Scan, Signature based Scan to detect malware. Run-time Protection provides crucial safety by detecting potentially unwanted application (PAU) and suspicious behavior.
24_7_365 Support
Rackspace Technology provides around-the-clock support for agent troubleshooting during deployment, visibility on agent health and critical event support.
Rackspace Technology makes no guarantees as to the effectiveness of the Host Protection service. This service enables the scanning of guest OS files by a system within the private cloud that maintains up-to-date signatures of known malicious code.
It is connected to a centralized management service maintained by Rackspace that enables visibility into the function of the service and allows tickets to be triggered if any failure with the scanning system occurs or in the event of malicious code being discovered.
Advanced Host Protection
It includes all features of Host Protection. Additionally, it has following features.
File Integrity Monitoring
Rackspace applies a standard File Integrity Monitoring policy to detect and prevent any unauthorized changes to windows file, folder or registry key. It also protects against insider threat and identifies unintended changes that can affect system performance or security.
Application Control
Rackspace helps to set a base Application Control policy for Audit trail and provides the detected executable software report to empower customer to set block or restrict applications based on the Organization’s acceptable policy as well as reduce the attack surface.
Data Loss Prevention
Rackspace provides enhanced data control and reduces the risk of non-compliance. Rackspace assists on Industry best practice set of rules to minimize risk of data exfiltration and accidental sharing sensitive data.
Data Loss Prevention Guide:
Data Loss Prevention (DLP) policies include one or more rules that specify conditions and actions to be taken when the rule is matched. When a file matches any of the rules in the DLP policy, it will violate the policy, log the event, and perform one of the following actions: allow the file to transfer, allow the file to transfer if the user confirms, or block the file transfer from taking place. Rackspace setups default action 'block the file transfer'.
Customer can select one of the templates from below options.
Region | Template | What sensitive data is covered in rules? |
Australia | General organisation activities [Australia] | *PCI-DSS (Payment Card Industry Data Security Standard) |
Canada | General organisation activities [Canada] | *PCI-DSS (Payment Card Industry Data Security Standard) |
Germany | General organisation activities [Germany] | *PCI-DSS (Payment Card Industry Data Security Standard) |
Spain | General organisation activities [Spain] | *PCI-DSS (Payment Card Industry Data Security Standard) |
UK | General organisation activities [UK] | *PCI-DSS (Payment Card Industry Data Security Standard) |
USA | General organisation activities [USA] | *PCI-DSS (Payment Card Industry Data Security Standard) |
Health and social care activities [USA] | *HIPAA (Health Insurance Portability and Accountability) | |
Finance and share trading activities [USA] | *GLBA (Gramm–Leach–Bliley Act) & SOX (Sarbanes-Oxley Act) |
Threat Alert Dashboard
Rackspace provides single pane of glass for actionable threat alerts and enrolled security service. It enhances visibility and facilitates self-service routine health check-up
Security Features | Legacy AV | Host Protection | Advanced Host Protection |
Antivirus | ✅ | ✅ | ✅ |
Download Reputation | ✅ | ✅ | ✅ |
Malware Protection (Includes Virus, Worms, Spywares etc.) | ✅ | ✅ | ✅ |
Automatic Threat Update Management | ✅ | ✅ | ✅ |
Automatic Malware Cleanup | ✅ | ✅ | ✅ |
Behavioral Analysis | ❌ | ✅ | ✅ |
Ransomware Protection & Exploit Protection | ❌ | ✅ (Windows) | ✅ (Windows) |
Context Sensitive Defense (Adaptive Attack Protection) | ❌ | ✅ (Only Windows) | ✅ (Only Windows) |
Deep Learning AI-powered malware prevention | ❌ | ✅ | ✅ |
Real-time (default), Scheduled, and On-demand Scans | ❌ | ✅ | ✅ |
Automated Installation (Enrollment) | ❌ | ✅ | ✅ |
Agent Health Monitoring | ❌ | ✅ | ✅ |
Alert Notification (Critical Event) | ❌ | ❌ | ✅ |
File Integrity Monitoring | ❌ | ❌ | ✅ (Only Windows) |
Application Control* | ❌ | ❌ | ✅ (Only Windows) |
Data Loss Prevention* | ❌ | ❌ | ✅ (Only Windows) |
Self-service Detection Dashboard | ❌ | ❌ | ✅ |
Data Protection
Rackspace Data Protection powered by Cohesity is a cutting-edge backup service that offers comprehensive data protection solutions to safeguard your critical business data. This innovative offering combines Rackspace's expertise in managed services with Cohesity's powerful data management platform, providing you with a seamless, secure, and scalable solution.
In addition to providing Protection at the Block level, this offering extends to provide File Level Backup using the cohesity Agent.
Supported Platforms
-
Currently, the SDDC Business and SDDC Enterprise plaforms are supported.
Pre-requisites
- Before enrollment virtual machines into Data Protection Agent based backup to protects files, each VM must have the Agent Installation completed.
- Reach out to Rackspace Network security for ensuring there is ServiceNet access enabled to the VMs
Enroll A VM into File Level Backup
Follow the Add-on enrollment steps Add-on Enrollment to deploy the Backup agent.
Initiate the enrollment from the Resources UI
Submit the enrollment, with the selected device
Security and Compliance
VM Management utilizes role-based access control (RBAC) to create granular control over permissions. When it comes to Rackspace employees, there are zero standing permissions granted. Rackspace employees are granted temporary access when performing a support task required by the customer. All remote access requests are logged and retained by Rackspace for security purposes.
Service Level Agreements
For the most up-to-date version of the SLAs (service level agreements) please review the terms and conditions page.
Billing and Payments
VM Management is billed at the VM level and is charged via usage per hour used on your monthly bill. The actual rate for VM Management varies depending on the add-on so please ask your seller for the current rates.
The bill for VM Management is available for viewing by customers within the Rackspace portal.
Support and Troubleshooting
RACI Diagram
For issues using the platform please put a ticket into your Rackspace portal asking for assistance with VM Management. For questions about the shared responsibility model for this product please review the RACI below.
| Task | Customer | Rackspace |
| General | ||
| Add-On Enrollment | Responsible | Optional Add-On |
| Agent Installation on Rackspace provided images | Inform | Responsible |
| Add-On Unenrollment | Responsible | Optional Add-On |
| Agent Installation on Customer provided images | Responsible | Optional Add-On |
| Troubleshooting | Consult | Responsible |
| Patching | ||
| Create Patching Groups | Consult | Responsible |
| Change Patch Baseline | Consult | Responsible |
| Change Patch Group | Consult | Responsible |
| Change Maintenance Window | Consult | Responsible |
| Monitoring | ||
| Configure Monitoring Agent | Inform | Responsible |
| Configure Thresholds | Inform | Responsible |
| Respond to Events | Inform | Responsible |
| Host Protection | ||
| Agent Installation | Inform | Responsible |
| Apply Updates | Inform | Responsible |
| Respond to Incidents | Inform | Responsible |
| OS Administration | ||
| Initiate Request | Responsible | Inform |
| Troubleshoot | Inform | Responsible |
For those fields that say ‘optional add-on’ in the above RACI contact your sales team and request more information about our Elastic Engineering or Professional Service offerings.
Terms of Service
VM Management terms and conditions can be found here:
https://www.rackspace.com/information/legal/guestosservices
Privacy Policy
Rackspace privacy policy can be found here:
https://www.rackspace.com/information/legal/privacystatement
Feedback and Suggestions
For all service requests please place a ticket in the ticketing portal, however, if you have feedback or suggestions for the design teams you can email us your feedback here at:
Important: The subject of your request should be as follows “VM Management Customer Feedback” and contain your account number in the body as well as any relevant detail to support your feedback.
Updated 3 months ago