Monitoring Cloud Databases in the Cloud Control Panel
Monitoring is included with Cloud Databases to help you manage the health of your instances. You can configure monitoring checks and alarms by using the Cloud Control Panel or the Cloud Monitoring API.
Monitoring checks describe the metrics that are being monitored, and monitoring alarms are actions that can be triggered when a check meets specified criteria. For example, a check for memory utilization records memory use on an instance. You can also configure an alarm to trigger and send an email when the memory check shows that free memory has dropped below a specified level.
The checks and alarms that are set up by default on a Cloud Databases instance are described in the following sections.
Checks
The monitoring checks for a Cloud Databases instance appear in the Monitoring Checks section of the Details page for that instance in the Cloud Control Panel.
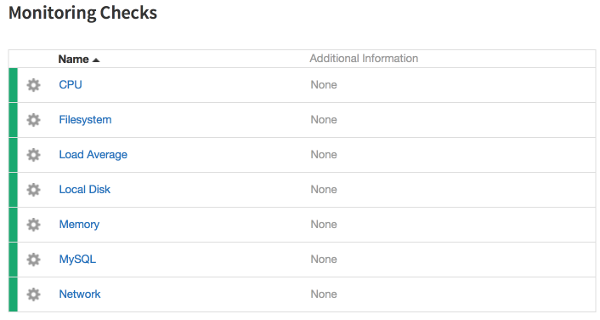
Click the name of a check to view a graph of the check's results over time and any alarms that are configured for that check.
The following monitoring checks are preconfigured for Cloud Databases instances.
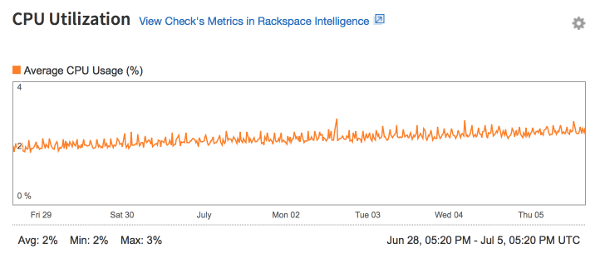
CPU Check
The graph for the CPU check displays how much of the CPU's available processing power the instance uses. It also displays the minimum, maximum, and average CPU usage for that period, as shown in the following image:
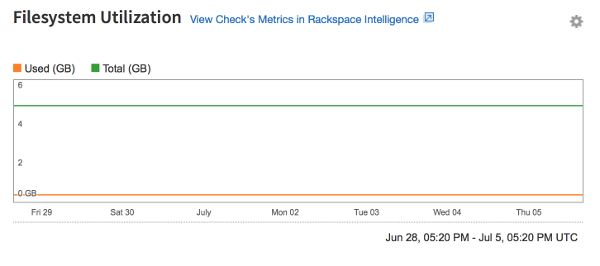
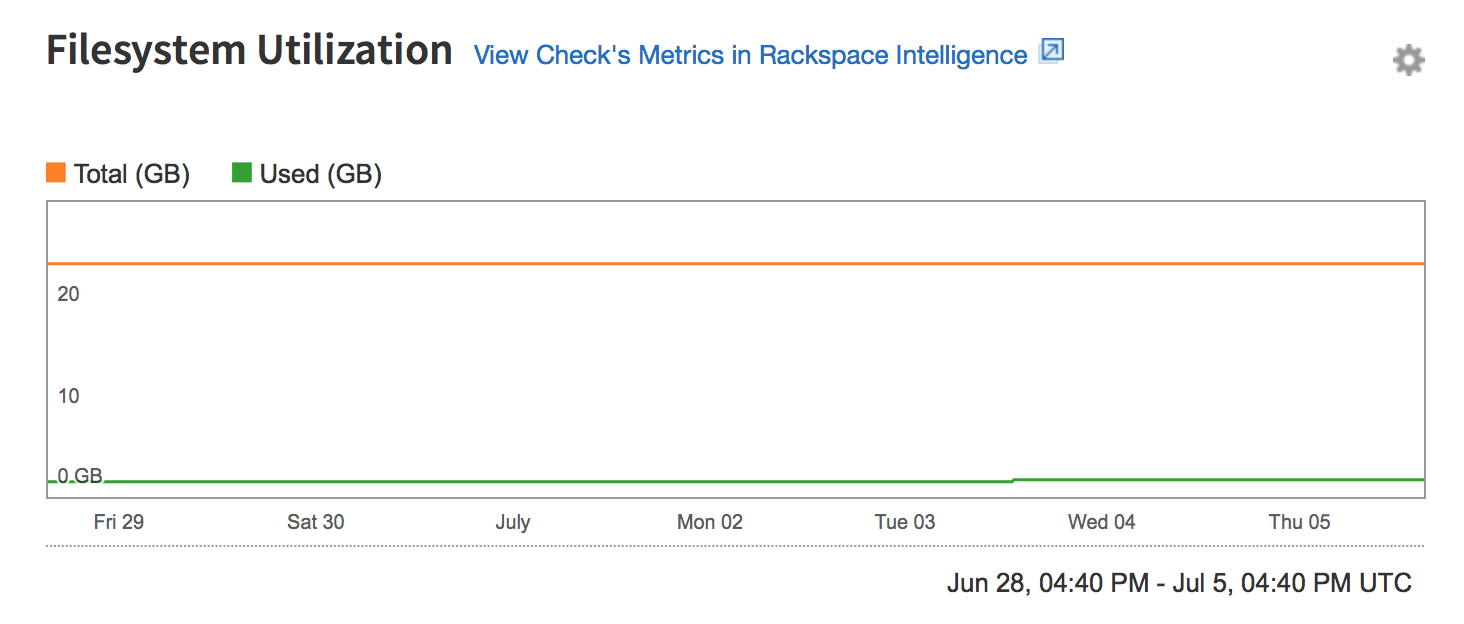
Filesystem Check
The graph for the Filesystem check displays disk usage for the Cloud Databases instance. The Used value represents the amount of disk space that the instance uses, and the Total value represents the total disk space that is available to the instance. This value can change if the instance is resized.
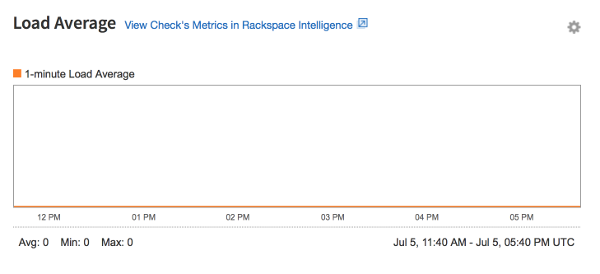
Load Average Check
The graph for the Load Average check displays the instance's load average on a per-minute basis. Whereas the CPU usage graph displays moment-to-moment fluctuations in CPU use, the Load Average graph reflects overall CPU usage, as shown in the following image:
Local Disk Check
The graph for the Local Disk check displays disk usage for the Cloud Databases instance root volume. The root volume is used to store replica logs if the instance participates in replication. The Total value represents the
total disk space that is available to the instance. This value changes if the instance is resized.
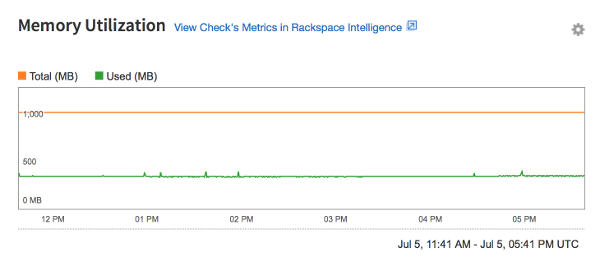
Memory Check
The graph for the Memory check displays the instance's memory use, or RAM. The Total value represents the total memory that is available to the instance, and the Used value represents the amount of memory that is in
use.
MySQL check
Graphs that report metrics for the MySQL database that is running on your instance are available in the Cloud Control Panel under Monitoring Alerts. #### Network check
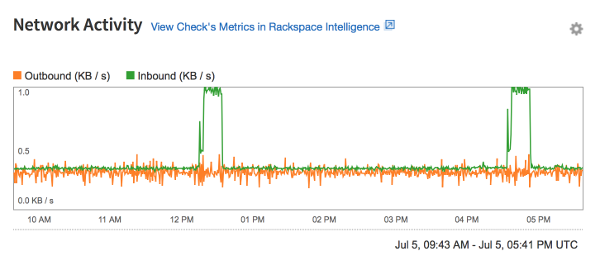
The graph for the Network check displays inbound and outbound network traffic in kilobytes per second, as shown in the following image:
Alarms
You can set up custom alarms that trigger notifications when defined criteria for monitored metrics are met. By default, Cloud Databases instances have an alarm configured to send an email alert when disk space is low.
You might need to add [email protected] to your contacts list to prevent email alerts from being marked as spam.
Create Alarms
Use the following steps to view and create alarms from the Details page for a check:
-
On the Details page for the Cloud Databases instance, click the name of the check for which you want to create an alarm.
-
In the Alarms section at the bottom of the page, click the Create Alarm button.
-
In the Alarm Name field, enter a name for the alarm.
-
Select the contact to receive notifications from the alarm. By default, this value is set to the technical contact on your account.
-
In the Alarm Criteria field, enter the criteria for the alarm. To view example criteria, click Example Alarm.
The metrics that are available for use as criteria are listed in the Available Metrics section of the alarm editing screen. A description of each metric is provided in the "Agent check types" section of the Cloud Monitoring API documentation.
The language that is used to define criteria for alarms is documented in the "Alert Triggering and Alarms"
section of the Cloud Monitoring API documentation.
Edit Alarms
To change the alarm name, alert recipient, or alarm criteria, click the gear icon next to an existing alarm and select an option from the menu.
Alarm Criteria Examples
The following sections provide example criteria for each of the Cloud Databases checks.
These examples define criteria for Warning, Critical, and OK statuses. By default, Warning and Critical statuses cause the text of the returned status to be emailed to the technical contact for your account. You can define more complex notification plans by using the Cloud Monitoring API.
The available metrics for all of the alarms are displayed in the alarm creation dialog box and are explained in the Cloud Monitoring API documentation.
CPU Alarms
The following criteria return a Warning status when CPU usage exceeds 90% and a Critical status when CPU usage exceeds 95%.
if (metric['usage_average'] > 95) {
       return new AlarmStatus(CRITICAL, 'CPU usage is #usage_average%, above your
    critical threshold of 95%');
    }
    if (metric['usage_average'] > 90) {
       return new AlarmStatus(WARNING, 'CPU usage is #usage_average%, above your description of the example code
    warning threshold of 90%');
    }
    return new AlarmStatus(OK, 'CPU usage is #usage_average%, below your warning
       threshold of 90%');
Filesystem Alarms
A monitoring alarm is included by default for this check. The criteria for the Low Disk Space alarm return a Warning status when disk usage exceeds 90% of the total space available and a Critical status when disk usage exceeds 95% of the total space available.
if (percentage(metric['used'], metric['total']) > 90) {
       return new AlarmStatus(CRITICAL, "Disk usage is above your critical threshold of
      90%");
     }

     if (percentage(metric['used'], metric['total']) > 80) {
       return new AlarmStatus(WARNING, "Disk usage is above your warning threshold of
    80%");
     }

    return new AlarmStatus(OK, "Disk usage is below your warning threshold of 80%");
Load Average Alarms
Use the following example criteria to create a Load Average alarm. You can set the time period that is used to calculate the load average to 1 minute, 5 minutes, or 15 minutes.
if (metric['5m'] > 1.5) {
       return new AlarmStatus(CRITICAL, '5 minute load average is #5m, above your
      critical threshold of 1.5');
      }

    if (metric['5m'] > 1) {
       return new AlarmStatus(WARNING, '5 minute load average is #5m, above your
    warning threshold of 1');
    }

    return new AlarmStatus(OK, '5 minute load average is #5m, below your warning
    threshold of 1');
Memory Alarms
The following criteria return a Warning status when the memory usage of the instance exceeds 80% and a Critical status when memory usage exceeds 90%.
if (percentage(metric['actual_used'], metric['total']) > 90) {
       return new AlarmStatus(CRITICAL, "Memory usage is above your critical threshold
     of 90%");
     }

    if (percentage(metric['actual_used'], metric['total']) > 80) {
       return new AlarmStatus(WARNING, "Memory usage is above your warning threshold of
    80%");
    }

    return new AlarmStatus(OK, "Memory usage is below your warning threshold of 80%");
Network Alarms
The following criteria return a Warning status when the network receive rate on eth0 exceeds 18350080B per second and a Critical status when the network receive rate on eth0 exceeds 24903680B per second.
if (rate(metric['rx_bytes']) > 24903680) {
       return new AlarmStatus(CRITICAL, "Network receive rate on eth0 is above your
     critical threshold of 24903680B/s");
     }

    if (rate(metric['rx_bytes']) > 18350080) {
       return new AlarmStatus(WARNING, "Network receive rate on eth0 is above your
    warning threshold of 18350080B/s");
    }

    return new AlarmStatus(OK, "Network receive rate on eth0 is below your warning
       threshold of 18350080B/s");
MySQL Alarms
The following criteria return a Warning status when the number of open connections exceeds 400 and a Critical status when the number of open connections exceeds 500.
if (metric['threads.connected'] > 500) {
       return new AlarmStatus(CRITICAL, 'Total number of threads connected are #
    { threads.connected}, above your critical threshold of 500');
    }

    if (metric['threads.connected'] > 400) {
       return new AlarmStatus(WARNING, 'Total number of threads connected are #
    {threads.connected}, above your warning threshold of 400');
    }

    return new AlarmStatus(OK, 'Total number of threads connected are #
    {threads.connected}, below your warning threshold of 400');
Explanations for the available metrics are located in the MySQL documentation for the relevant server status variables.
Updated 2 months ago