View Basic Graphs of Activity in Rackspace Intelligence
Rackspace Intelligence provides a set of predefined graphs that show the activity of all the metrics and checks that have been defined for your monitoring entities.
If you want to explore a metric across multiple entities, consider using custom graphs. For more information, see Creating custom graphs of activity in Rackspace Intelligence.
View Basic Graphs
To view the predefined graphs that are available to you, click Visualize at the top of the interface, and then click Basic Graphs.
To view any of the default graphs for your entities, click Rackspace Default under Graph Collections.
To view a graph for a specific check, in the Graphs by Check section, click the name of the check for which you want to see the graphs, such as CPU.
A list of graphs are displayed that are available for your check.
Work with Favorites
Rackspace Intelligence lets you specify one or more favorite graphs and filter for your favorites. To mark a graph as favorite, click the star icon to the left of the title of the graph.
To filter for your favorite graphs, click Favorites under Graph Collections.
Specify a Time Range
Rackspace Intelligence lets you use preset or custom time ranges for the data that is collected and displayed in graphs.
If you choose a preset time range, Rackspace Intelligence shows data collected for the entity during the most recent period of that range:
- One hour
- Eight hours
- One day
- One week
- One month
If you choose a custom time range and click Apply, Rackspace Intelligence shows data collected for the entity between the first- and last-time stamp.
Adjust the Layout of Your Graph Page
You can adjust the way your graphs are displayed on the page by selecting one of the display icons on the top-right corner of the page. You can choose to display graphs side-by-side in a grid or display them in a linear sequence.
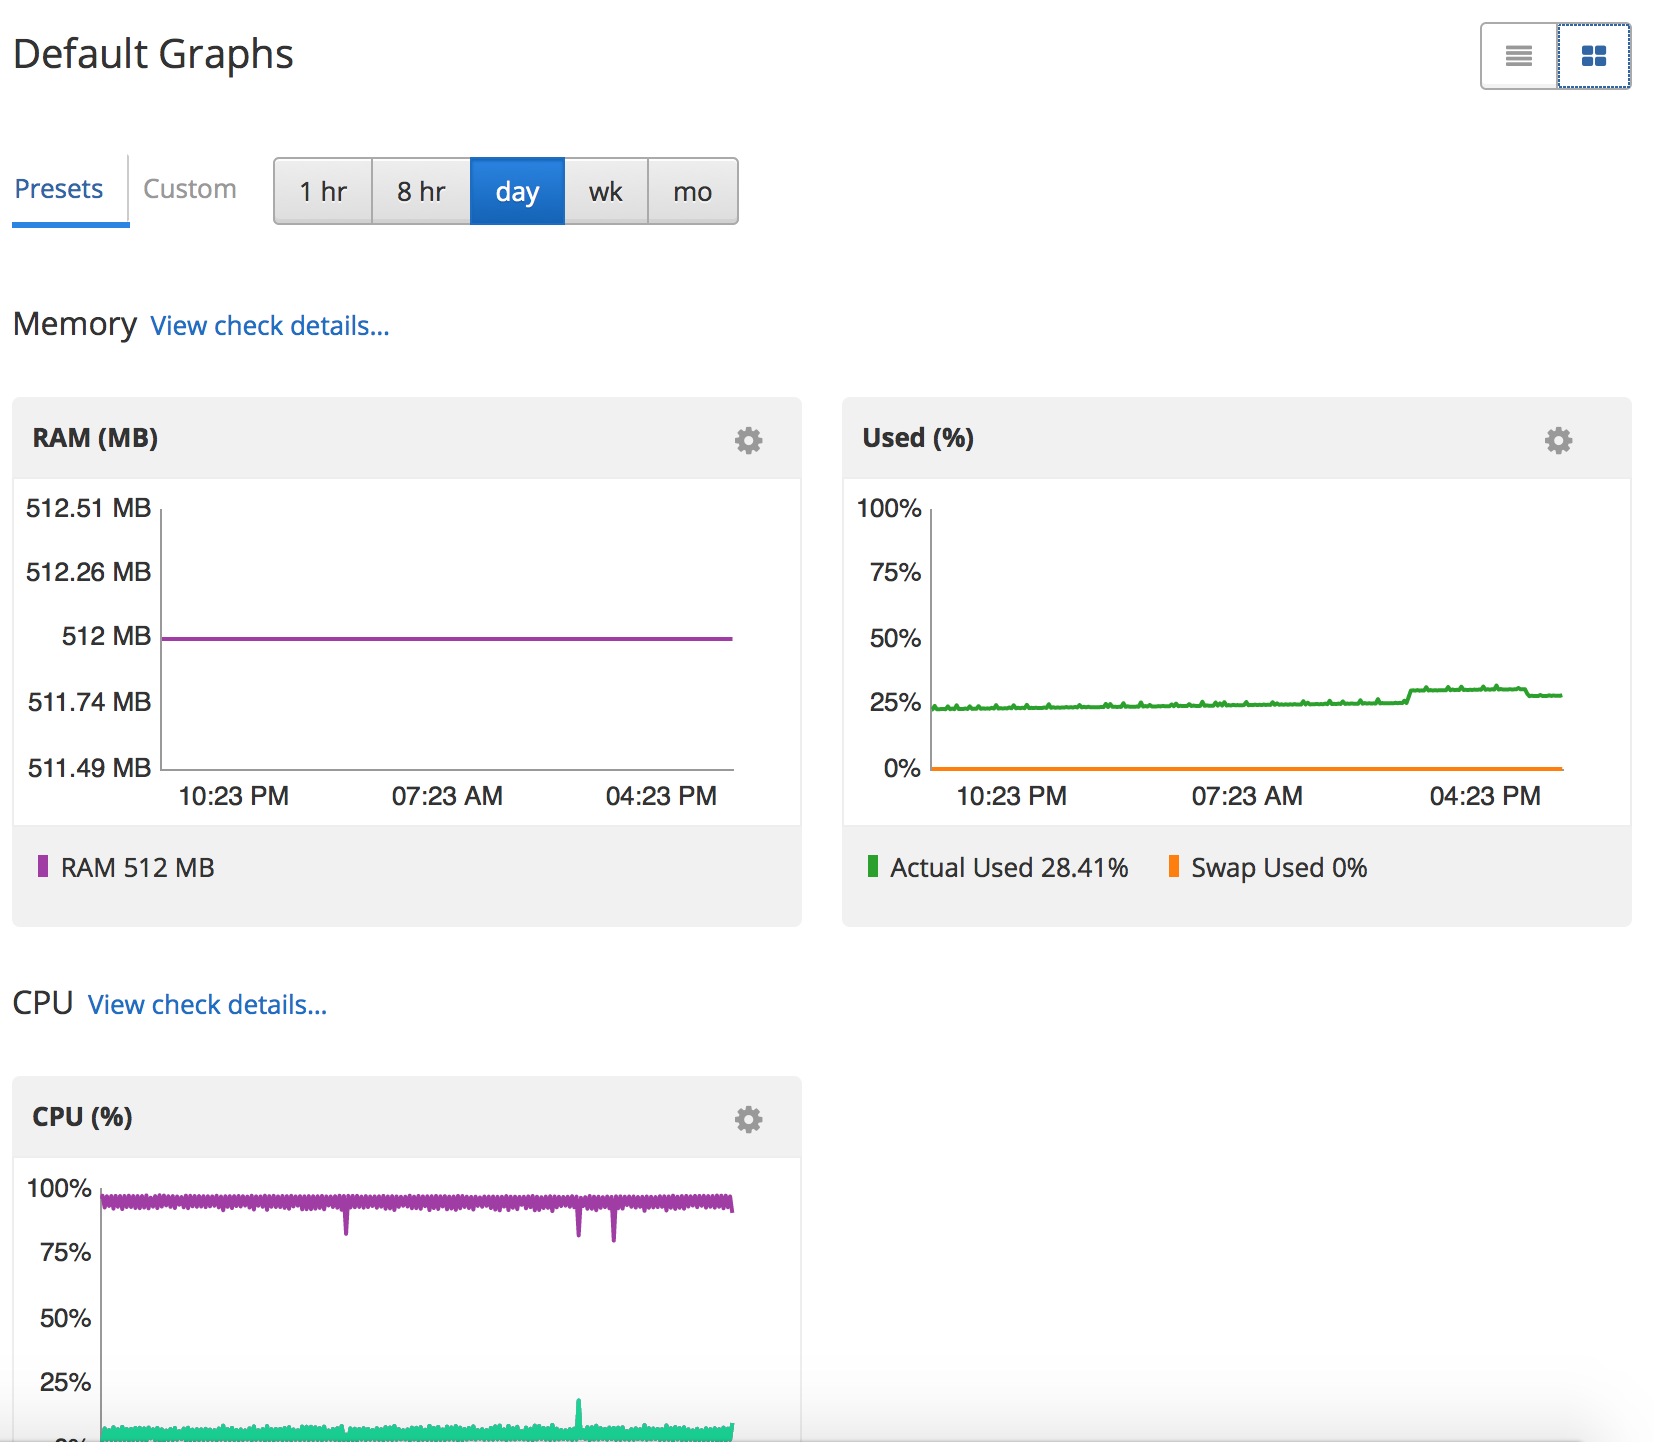
The following example shows a grid layout:
Updated about 1 year ago