Monitor Network Traffic
Basic Essential Network Monitoring
This article discusses the following topics:
- Monitoring in Linux
- About the VNstat and IPtraf tools
- Ubuntu operating systems and Debian installation
- CentOS and RHEL installation
- Fedora (16+) installation
- openSUSE installation
- How to use VNstat
- How to use IPtraf
- How to use Tcpdump
Basic administration principles state that the administrator should have a strong grasp on what a server is doing at all times. One major metric that you might miss is overall network activity. The metrics collected by proper network monitoring can reveal your traffic trends, which leads to a better understanding of the trends for your application, the load times on your system, and any activity that you might not have accounted for. Monitoring is essential to a successful infrastructure, and, without it, you are forced to guess or interpret logs, which might lead to misunderstanding the real traffic going to, and leaving, your server.
As an alternative to the setup described in this article, Rackspace offers its Cloud Monitoring service at no cost for use with Cloud Servers. For more information about this flexible service, see Getting Started with Cloud Monitoring.
Monitoring in Linux
In the world of Linux®, many open-source solutions exist that can accomplish the lofty goals of monitoring and logging actual traffic. Most of these free, Open Source tools can work with minimal setup and achieve very high accuracy. This article focuses on VNstat and IPtraf, which can be found in most repositories, have minimal dependencies, and work on all Linux systems.
About the VNstat and IPtraf tools
VNstat : Learn More about VNstat
VNstat is a console-based network traffic monitor for Linux that keeps a log of network traffic for the selected interfaces. It uses the network interface statistics provided by the kernel to collect traffic details instead of sniffing actal network traffic. With VNstat, you can log all incoming and outgoing traffic by minute, hour, day, month, and year.
IPtraf : Learn More about IPtraf
IPTraf is a console-based network statistics utility for Linux. It gathers a variety of figures including the following types:
- Transmission Control Protocol (TCP) connection packet and byte counts
- Interface statistics and activity indicators
- TCP and User Datagram Protocol (UDP) traffic breakdowns
- LAN station packet
- Byte counts
How to install VNstat and IPtraf
The following sections provide steps to install these VNstat and IPtraf in various
operating systems.
Ubuntu operating systems and Debian installation
Install VNstat and IPtraf on Ubuntu operating systems and Debian
Use the following steps to install VNstat and IPtraf on an Ubunto® or Debian® slice:
-
Use the following commands to search for the following packages from Ubuntu operating systems and Debian repositories:
apt-get update
apt-cache search iptraf
iptraf - Interactive Colorful IP LAN Monitorapt-cache search vnstat
vnstat - console-based network traffic monitor -
Use the following command to install the tools on your server:
apt-get install iptraf vnstat
-
Use the following commands to configure VNstat to begin monitoring the interfaces:
Public Interfacevnstat -u -i eth0
Private Interfacevnstat -u -i eth1
CentOS and RHEL installation
You can install IPTRAF In the base repositories for CentOS® and RHEL®, but VNstat is not not found in these repositories. You either need to install it by using a third-party repository or compile it from the source. This article demonstrates compilation from the source install because VNstat is a small package and has no real dependencies. At the time of this writing, VNstat 2.2 is the latest version available.
Install VNstat on CentOS and RHEL
Use the following steps to install VNstat on a CentOS or RHEL slice:
-
Run the following commands to download and unpack the source:
cd ~/
wget https://humdi.net/vnstat/vnstat-2.2.tar.gz
tar xzf vnstat-2.2.tar.gz
cd ~/vnstat-2.2 -
Run the following commands to install
gccandmake, if they are not installed, and install VNstat:yum install gcc make
make
make install -
Run the following commands to start VNstat and to configure it to automatically restart on boot:
cp ~/vnstat-2.2/examples/init.d/redhat/vnstat /etc/init.d/vnstat
chmod +x /etc/init.d/vnstat
/etc/init.d/vnstat start
cd /etc/init.d/
chkconfig --add vnstat
chkconfig vnstat on
cd ~/ -
Run the following commands to configure VNstat to begin monitoring the interfaces:
Public Interfacevnstat -u -i eth0
Private Interfacevnstat -u -i eth1
Install IPtraf CentOS and RHEL
Use the following steps to install IPtraf:
-
Use the following command to search for the IPtraf package:
yum search iptraf ## iptraf.x86_64 : A console-based network monitoring utility. -
Use the following command to install IPtraf:
yum install iptraf.x86_64
Fedora installation
Install VNstat and IPtraf on Fedora
Use the following steps to install VNstat and IPtraf on a Fedora® 16+ slice:
-
Use the following commands to search for the following packages from Fedora repositories:
yum search iptraf
iptraf.x86_64 : A console-based network monitoring utilityyum search vnstat
vnstat.x86_64 : Console-based network traffic monitor -
Use the following command to install VNstat and IPtraf on your server:
yum install iptraf vnstat
-
Use the following commands to configure VNstat to begin monitoring the interfaces:
Public Interfacevnstat -u -i eth0
Private Interfacevnstat -u -i eth1
-
Use the following comand to create a symlink for legacy purposes:
ln -s /usr/sbin/iptraf-ng /usr/sbin/iptraf
openSUSE installation
You can install IPtraf In the base repositories for openSUSE®, but VNstat is not not found in these repositories. You either need to install it by using a third-party repository or compile it from the source. This article demonstrates compilation from the source install because VNstat is a small package and has no real dependencies.
Install VNstat on openSUSE
Use the following steps to install VNstat on an openSUSE slice:
-
Use the following commands to download the source and unpack the source:
cd ~/
wget https://humdi.net/vnstat/vnstat-2.2.tar.gz
tar xzf vnstat-2.2.tar.gz
cd ~/vnstat-2.2 -
Run the following commands to install
gccandmake, if they are not installed, and install VNstat:zypper ref
zypper in gcc make
make
make install -
Run the following commands to start VNstat and to configure it to automatically restart on boot:
cp ~/vnstat-2.2/examples/init.d/redhat/vnstat /etc/init.d/vnstat
chmod +x /etc/init.d/vnstat
/etc/init.d/vnstat start
cd /etc/init.d/
chkconfig --add vnstat
chkconfig vnstat on
cd ~/ -
Use the following command to configure VNstat to begin monitoring the interfaces:
Public Interfacevnstat -u -i eth0
Private Interfacevnstat -u -i eth1
Install IPtraf on openSUSE
Use the following steps to install IPtraf:
-
Use the following command to search for the IPtraf package:
zypper se iptraf
iptraf | TCP/IP Network Monitor | srcpackage -
Use the following command to install iptraf:
zypper in iptraf
How to use VNstat and IPtraf
The following sections provide basic instructions for using VNstat and IPtraf.
How to use VNstat
To learn more about VNstat, check out the Manual Page for VNstat.
After you have installed and set up VNstat, you need to wait at least ONE hour for your database to contain data and begin to show some metrics.
The following examples show some common VNstat commands with sample output:
Snapshot: vnstat
                      rx      /      tx      /     total    /   estimated
 eth0:
       Apr '12     26.68 MiB  /  196.70 MiB  /  223.38 MiB  /    1.38 GiB
     yesterday      6.35 MiB  /   37.71 MiB  /   44.06 MiB
         today      4.73 MiB  /   34.66 MiB  /   39.39 MiB  /      52 MiB
Hourly report: vnstat -h
 eth0                                                                     17:02
  |            t  t                    t  t  t  t              t  t  t
  |      t     t  t                    t  t  t  t     t     t  t  t  t
  |      t  t rt rt    rt  t  t        t  t  t  t  t  t  t  t  t  t  t  t
 -+--------------------------------------------------------------------------->
  |  18 19 20 21 22 23 00 01 02 03 04 05 06 07 08 09 10 11 12 13 14 15 16 17
 h  rx (KiB)   tx (KiB)      h  rx (KiB)   tx (KiB)      h  rx (KiB)   tx (KiB)
18        157        607    02        143        888    10        150       1878
19        266       1389    03        169        548    11        212       1229
20        259        918    04         72        449    12        191       1904
Daily report : vnstat -d
 eth0  /  daily
 eth0  /  daily
         day         rx      |     tx      |    total    |   avg. rate
     ------------------------+-------------+-------------+---------------
      04/01/12      4.91 MiB |   43.77 MiB |   48.67 MiB |    4.61 kbit/s
      04/02/12      6.65 MiB |   46.65 MiB |   53.30 MiB |    5.05 kbit/s
      04/03/12      4.04 MiB |   33.92 MiB |   37.96 MiB |    3.60 kbit/s
      04/04/12      6.35 MiB |   37.71 MiB |   44.06 MiB |    4.18 kbit/s
      04/05/12      4.73 MiB |   34.66 MiB |   39.39 MiB |    5.26 kbit/s
     ------------------------+-------------+-------------+---------------
     estimated         5 MiB |      47 MiB |      52 MiB |
Weekly report : vnstat -w
 eth0  /  weekly
                      rx      |     tx      |    total    |   avg. rate
   ---------------------------+-------------+-------------+---------------
    last 7 days     36.62 MiB |  256.09 MiB |  292.71 MiB |    4.13 kbit/s
      last week     42.62 MiB |  237.17 MiB |  279.78 MiB |    3.79 kbit/s
   current week     21.79 MiB |  152.97 MiB |  174.75 MiB |    4.46 kbit/s
   ---------------------------+-------------+-------------+---------------
      estimated        39 MiB |     286 MiB |     325 MiB |
Monthly report: vnstat -m
 eth0  /  monthly
      month        rx      |     tx      |    total    |   avg. rate
    ------------------------+-------------+-------------+---------------
      Apr '12     26.68 MiB |  196.70 MiB |  223.38 MiB |    4.50 kbit/s
    ------------------------+-------------+-------------+---------------
    estimated       165 MiB |    1.22 GiB |    1.38 GiB |
How to use IPtraf
IPtraf watches traffic in real time, and you can use it as soon as it is installed.
To learn more about IPtraf, check out the Manual Page for IPtraf.
The following examples show some common IPtraf commands with sample output:
General output: iptraf -g
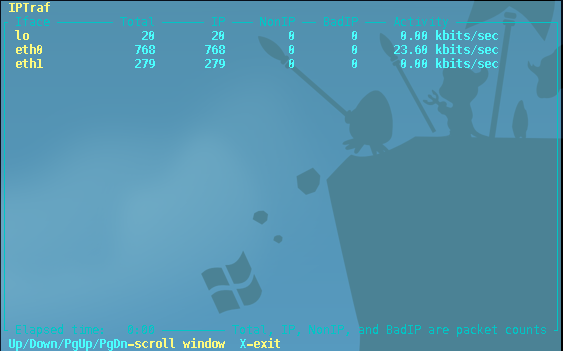
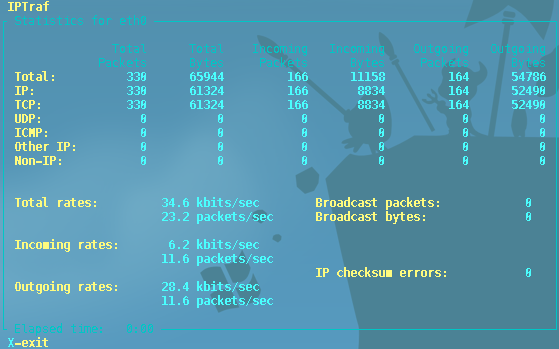
Detailed Information on a selected interface: iptraf -d iface
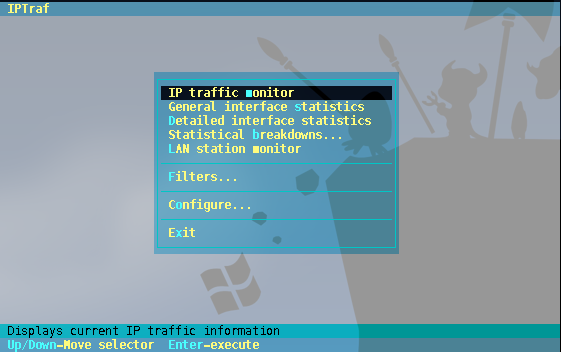
Semi-Graphical interface: iptraf
Conclusion
After you install these packages, you have full network monitoring in place. VNstat monitors the servers' internal and external network interfaces for all sent and received traffic. IPtraf allows you to use a utility from the shell to gauge network traffic in real time. These tools are invaluable and provide insight into your overall operations.
Updated about 1 year ago