Pre-go-live Activities
Before you go live with your application, you work with the Rackspace Application Services team to:
- Establish your implementation objectives and timeline.
- Identify the applications and transactions that you want to monitor.
- Define alerts.
- Write a runbook that outlines the actions that the Rackspace Application Services team takes when an alert is triggered.
Your work in the pre-go-live phase of your implementation ensures that you don’t need to delay your go-live date and that you transition smoothly into the post-go-live phase of your project.
- Onboarding timeline
- Add your teams to APM tooling
- Write a runbook
- Define a synthetic monitor
- Tune business transaction
- Development best practices
Onboarding Timeline
This section describes the implementation milestones you reach during the first 30 days of working with the Rackspace Application Services team.
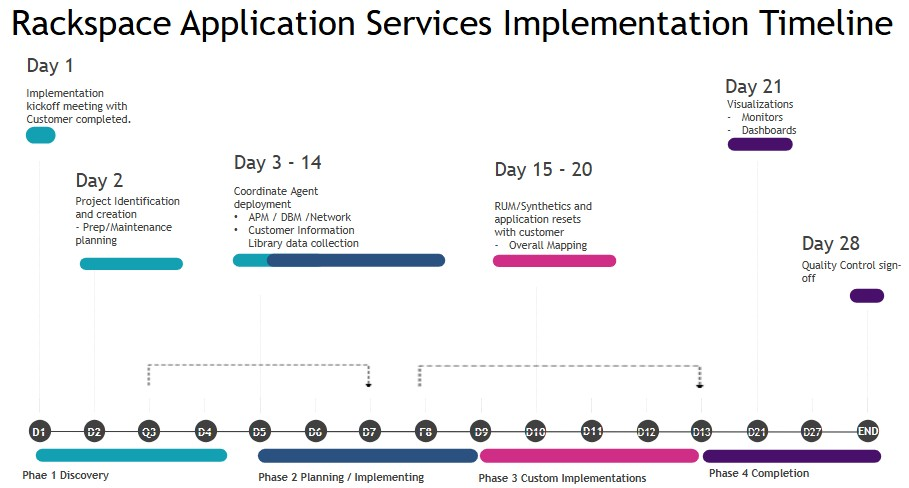
Implementation Kickoff Meeting Completed
After the Rackspace Application Services team adds you to Rackspace systems, you receive a ticket that provides information about your build and implementation services and a request for times to schedule an implementation meeting.
When you meet with the RAS team, you discuss your project, and the implementation services you receive.
Project Identification and Creation
The RAS team uses internal Rackspace project management tools, as well as our ticketing system to track your implementation. Project identification and creation is an internal milestone associated with populating Rackspace product management tools with project tasks. You don’t need to do anything to reach this milestone.
Information Library Data Collection
Your information library data collection is another internal milestone. To reach this milestone, the RAS Digital Experience team populations an internal knowledge base with your information, such as account number, escalation contact information, build information, and so on.
Coordinate APM Agent and Application Resets
This milestone consists of the following tickets that require your input:
- Install agents: Work with the RAS team to identify the devices and applications on which to install data collection agents. It is important to ensure that the devices and applications are available and that the Rackspace Application Services team has access to them.
- Library Data Collection: Your information library data collection is another internal milestone. To reach this milestone, the RAS team populates an internal knowledge base with your information, such as account number, escalation contact information, build information, and so on.
- Create a runbook: A runbook contains procedures that the Rackspace Application Services team follows when alerts are triggered.
RUM/Synthetics
- Define synthetic monitors: Provide the RAS team with detailed steps of the business transactions that you want to monitor. For more information about defining synthetic monitors.
Visualizations
- Create Custom Dashboards: Build unified dashboards combining the APM Tool's curated views to provide actionable insights for engineering and product teams.
- Configure alerts: Assist the RAS team in defining alerts that fire when specific system events occur.
- Go/no-go live confirmed: Before you go live with your application monitoring solution, meet with the RAS team to verify the launch date, ensure that devices are monitored, and ensure that alerts are identified and properly configured.
Quality control signoff
The final milestone in the implementation process is a final quality control step that ensures that all tickets have been completed and closed.
Add Your Teams to APM Tooling
You can ask the RAS team to provide you with read-only access to either Datadog or New Relic® so that you can view the dashboard and metrics. Because you have read-only access, you must submit a ticket to the RAS team to request a change to any devices or application you are monitoring.
If you want another member of your organization or a third party to access the APM tool, you must provide the RAS team with the following information for that person or party:
- First name
- Last name
- Email address
If you want a third party to be able to create tickets or call Rackspace Support for help, consider the following guidelines:
- The third party must be added to the Rackspace Customer Portal. If a use is not defined in our system, we cannot provide support. Due to confidentiality, we are prevented from providing any kind of information.
- If you add a third party to the Rackspace Customer Portal, we assume that they are also entitled to use pre-purchased consulting hours.
Write a runbook
A runbook is an optional document that contains mutually agreed-upon actions that Rackspace should take on your production environment each time there is an alert. The purpose of a runbook is to return your system to service as quickly as possible. After your system returns to service, you can work with Rackspace to perform root cause analysis to determine the cause of the alert.
Runbook procedures do not apply to non-production environments, including test, development, and staging environments.
Why you should write a runbook
You should write a runbook because Rackspace can return your system to service much more quickly than without a runbook. Because a runbook contains known issues that result in alerts firing, Rackspace engineers can skip some required diagnostic steps.
If you choose not to write a runbook, Rackspace uses the following prescribed set of steps each time an alert fires:
- Determine if the traffic rate has increased over the last few hours or days.
- Determine if the error rate and response times have increased.
- Review warning violations that could point to a transaction or group of URLs that might have higher response times.
- Investigate individual transactions and determine if any method calls take a long time to return.
- Check the database to determine which queries are running and how much CPU time the queries require.
Without a runbook, Rackspace can take much longer to diagnose an issue and return your system to service.
Runbook Contents
During the runbook creation process, Rackspace performs the following activities:
- Develops an operations runbook following the transition plan that complies with the following conditions:
- Where a change in law affects a change in policy, both parties discuss this change in good faith.
- The parties shall develop and follow specific procedures, which are described in the operations runbook, during the term of the contract.
- The operations runbook describes the procedures both parties use to perform the services.
- The operations runbook conforms to Rackspace policies and, were reasonably possible, your policies. If there is any discrepancy between the operations runbook and this Service Description, the terms of the runbook prevail.
- You and Rackspace jointly use the operations runbook to enable close cooperation and communication between the parties.
- The operations runbook includes checkpoint reviews, testing, acceptance, and other procedures to ensure the quality of Rackspace performance.
- Performs the services according to your approved operations runbook.
The operations runbook contains the following items, at a minimum:
Item |
Description |
Example |
|---|---|---|
Hours of use |
The hours that you primarily use this application |
24x7x365 09:00 - 17:30 Monday to Friday |
Business criticality |
On a scale of Tier 1 (critical) to Tier 4 (non-critical), what tier is this application? |
Tier 1 - Critical |
Support hours |
Any agreed support hours that we must adhere to |
24x7x365 08:00 - 18:00 Monday to Friday |
Allowable maintenance window |
Any pre-agreed maintenance time for this platform or application |
On your agreement, only or third (3rd) Sunday of the month |
Incident management process |
Standard incident management process and major incident management process |
A hyperlink to the pre-agreed standard and major incident management processes |
Change management process |
Standard and emergency change advisory board (ECAB) change management processes |
A hyperlink to the pre-agreed change and ECAB processes |
Escalation contacts |
Agreed platform and escalation processes Note Ensure that you provide an after-hour contact, the times the contact is available, and the time zone. |
A hyperlink to the pre-agreed platform and application escalation contacts |
Application owner |
The application owner |
Named contact |
Business owner |
The business owner |
Named contact |
Logical view |
A description of the platform or application |
The DummyTest application runs a total of six VM servers between LON5 and LON3 data centers with a physical MSSQL backend database based in LON3 as active, LON5 as failover. |
Application dependencies |
Any known application dependencies |
If application A doesn’t function, the search engine in application B doesn’t function. |
Infrastructure scope |
Identified and documented infrastructure used within the platform or application |
12345-dummyapp1.company.co.uk 23456-dummyapp2.company.co.uk |
Monitoring configuration |
Documented URL, port, and server monitoring configuration set up and implementation |
A hyperlink to the configuration set up for URL, port, and server monitoring configuration and implementation |
Customer-supplied high-level design (HLD) |
Any additional design documentation supplied by you |
An application or platform design document |
Disaster Recovery (DR) process |
If the platform or application has DR, a link to the DR process that is maintained by you |
A hyperlink to the DR process |
Define a Synthetic Monitor
A synthetic monitor is a NodeJS script that mimics the steps of a user transaction and tests for the success or failure of that transaction. Common synthetic monitor transactions include a search transaction, a login transaction, and an ecommerce transaction. If any step of a transaction fails, the monitor can help identify where the problem originated.
For example, the synthetic monitor can reveal a problem with the command that writes a record to a database or that the tax calculated during the Add to Cart step isn’t correct. Synthetic monitors can identify problems with your site before they negatively affect your business.
A synthetic monitor runs 12 times each hour, 24 hours per day. You can run synthetic monitors in different geographic locations (except Antarctica), depending on the location of your user base. You can check multiple geographies simultaneously. If there is an error in any of the 288 daily transactions, the monitor automatically creates an emergency ticket. After Rackspace acknowledges the ticket and tests the Internet connections, Rackspace consults the runbook for guidelines.
Collaborating with Rackspace to write a runbook is extremely important.
The user transactions that you want to test are up to you, based on your business requirements. Rackspace relies on you to identify the transactions you want to test and to provide the steps of each transaction. Rackspace sends a ticket requesting that you define your synthetic monitors.
Refer to the following example when you provide Rackspace with documentation about the synthetic monitors that you want to create:
Synthetic monitor name: Add Item to Cart
Result of transaction: By the end of this transaction, the user has searched for and added an item to the cart.
Steps:
- Open a browser and navigate to acme.com.
- On the top navigation bar, click Products > Shirts.
- Review the list of available shirts.
- Select a shirt and click Add to Cart.
- To begin the purchasing process, click Cart.
- Click Checkout.
After you provide the detailed steps to Rackspace, Rackspace creates a NodeJS script that includes the steps you have documented.
The following NodeJS example includes the steps identified above:
/** BEGINNING OF SCRIPT **/// Step 1
.then(function() {
  log(1.1, 'Browse to site.');
  return $browser.get("Url");
})// Step 2
.then(function() {
  log(2, 'Click PRODUCTS list');
  $browser.findElements(By.linkText("PRODUCTS"))
  .then(function(elements) { elements[0].click(); });
})// Step 3
.then(function() {
  log(3, 'Click SHIRTS');
  $browser.findElements(By.linkText("SHIRTS"))
  .then(function(elements) { elements[0].click(); });
})// Step 4
.then(function() {
  log(4, 'Click "ADD TO CART".');
  $browser.switchTo().defaultContent();
  return $browser.waitForAndFindElement(By.id("btn-addtocart"), DefaultTimeout)
  .then(function (el) { el.click(); });
})// Step 5
.then(function() {
  log(5, 'Click CART.');
  return $browser.waitForAndFindElement(By.linkText("CART"), DefaultTimeout)
  .then(function (el) { el.click(); });
})// Step 6
.then(function() {
  log(6, 'Click CHECKOUT.');
  return $browser.waitForAndFindElement(By.id("CHECKOUT"), DefaultTimeout)
  .then(function (el) { el.click(); })
}).then(function() {
  log(lastStep, '');
  console.log('Browser script execution SUCCEEDED.');
}, function(err) {
  console.log ('Browser script execution FAILED.');
  throw(err);
});/** END OF SCRIPT **/
You can sign off on the script before Rackspace deploys it. After you approve, Rackspace tunes the script to remove popup messages.
Rackspace is responsible for the ongoing maintenance of the script. As you make changes to the user interface of your site, ensure that you coordinate with Rackspace so that Rackspace updates your synthetic monitors.
Tune Business Transactions
Your application monitoring solution relies on you and the RAS team to identify the critical business transactions that you want to monitor. When you come on board as a Rackspace Application Services customer, you can choose to use either Datadog or New Relic as your application performance monitoring tool. Critical business transactions are the set of pages on your site that are more important than others.
For example, you might want to receive a notification when the Add to Cart page doesn’t load properly for a customer. Because this page is directly tied to revenue, it’s critical for you to know when it isn’t available. Other important pages include the Login page and the Search Results page.
For pages associated with a critical business transaction, the Rackspace Application Services team can:
Add custom alert thresholds that monitor page response time and error rates.
- Add custom alert thresholds that monitor page response time and error rates.
- When the defined threshold is exceeded, the Rackspace Application Services team automatically receives a ticket, and they consult the runbook for instructions on how to proceed.
- Configure a custom dashboard that displays business transaction metrics.
- Document runbooks that outline procedures to follow when responding to custom alerts.
To prevent alert fatigue, limit the number of monitored business transactions to 10.
As you continue to develop your application and add critical business transactions, ensure that you communicate to the RAS team about the changes you make.
Development Best Practices
Because applications evolve as your business evolves, your development team is critical for running and maintaining your web applications. To ensure success, approach application development in a structured, systematic fashion.
When you plan your application development and deployment strategies, think about your application from a governance perspective. Ensure that the governance plan includes policies for the following DevOps areas:
- Source control and branch management
- Development tools (for example, VS, VS Code, and so on)
- Team communication
- Deployment tools and release management packaging, continuous integration, continuous delivery, blue/green, monitoring, and rollback)
- Deployment targets (don’t test in production)
- Testing methods (user, load, smoke, sanity, and regression)
- Infrastructure management (infrastructure as code, ARM templates)
- Escalation points (internal and external)
- DataOps and DevSecOps integration
- External integrations and APIs
- Rollback plan (for example, backup databases before deployment, redeploy previous code)
This section includes best practices for each of the following DevOps development lifecycle phases:
- Planning and design
- Build
- Testing
- Release and deployment
- Monitor
Planning and Design
Consider the following guidelines during the planning and design phase of your project:
Pick your coding methodology: A coding methodology is a framework and set of processes that organize the development process. These methodologies provide guidance about:
- How you gather requirements
- How you make decisions
- How the cycles of software development flow into each other and influence your choice of branching strategy and team structure.
While many development methodologies are available, Agile, Lean, Waterfall, and Scrum are the most common methodologies IT organizations use to manage their projects. Keep in mind that every methodology has its pros and cons. A methodology that fits your project and available resources becomes a driving factor in steering your team toward success.
Decide on your branching strategy: When you start or revamp a development process, consider which branching strategy is right for your team and project. Consider how large the development team is, whether multiple teams or a single team develop the code, and how often the code changes. While hybrid strategies are tempting, they are often more difficult to implement. All effective branching strategies include source-code management tools, such as GitHub.
Standardize your environment: After you identify a strategy, you should standardize the development environment and processes that developers use when coding. We recommend that your developers use the same integrated development environment (IDE) to enable team collaboration. By using the same IDE, developers use the same linting process that identifies code errors. When developers use the same IDE and linting process, you ensure that the application has a consistent quality level.
Build
Consider the following guidelines when you plan your application build processes:
Incorporate unit testing: Unit tests operate on a software component to test basic functionality independent of other factors. For example, a common requirement for many web applications is to calculate sales tax. A sales tax unit test verifies that the calculated tax rate is correct. Other separate unit tests ensure that items added to the cart are visible in the cart and that the credit card information is valid. As opposed to a large, single test that incorporates all of your site’s functionality, unit tests can save development time because they help you to identify defective code efficiently. Unit tests also encourage modular coding, making it easier for you to reuse and make updates to your code.
Automatic builds: It is useful to configure automatic builds in non-production environments so that a build runs whenever a developer checks in code. In addition to automating a step, which allows developers to use their time more effectively, automated builds provide real-time feedback if the code introduces a significant error.
Continuous integration/Continuous deployment: Continuous integration (CI) and Continuous deployment or delivery (CD) are often linked together in modern software development methodologies. Continuous integration refers to the process of frequently merging code updates back into the main branch, often several times throughout the day, when developers address discrete features or defects. By frequently merging or integrating code, your developers’ local repositories are kept in sync, which reduces the time required to complete each merge operation. CD commonly refers to continuous deployment, a build process where deployments are performed automatically as developers check in code throughout the day. CD can also refer to continuous delivery, which is similar to continuous deployment in that the main branch can always be deployed, but it does not necessarily get deployed each time a developer merges code. The automation that enables CI/CD is called a CI/CD pipeline.
Testing
Consider the following guidelines when you plan your application testing strategy:
Automate testing: You can use a tool like Selenium to run your smoke tests. Selenium automates much of the testing work and has the added benefit of performing the final, post-deployment checks on your production environment. This final check quickly catches issues during the coding process before they impact your users. Because Selenium automates testing, your QA team can perform more thorough tests than they otherwise have time to conduct.
Load testing: After you update the application, you should perform load tests that identify performance bottlenecks. Apache® JMeter is an application that enables you to load test your application and identify issues that are only visible when the system is under a high load, such as during a sale or other peak times.
Code reviews: Automated tests are an essential part of software development, but collaboration between developers remains an important activity that should be encouraged. Working with colleagues and mentors via code reviews not only decreases defect rates for a low investment but also provides valuable team building, employee growth, and camaraderie.
Release and Deployment
Consider the following guidelines when you plan your release and deployment strategy:
Deployment: You, our Named Application Engineers, and our Application Support Engineers collaboratively determine the steps to take during a deployment.
- By using the requirements gathered during discussions with your team, our Named Application Engineers develop the automation jobs required for your deployments.
- The Application Support Engineers use the automation jobs and high-level processes to define deployment templates that provide detailed deployment steps.
- The Application Support Engineers use the deployment templates to create maintenance plans for each deployment.
- Another ASE reviews the templates to ensure their quality and that there are no anticipatable issues.
- An ASE works with your team to deploy your application.
Rollback plan: If a deployment fails, it is important that you have a documented and tested rollback plan in place. Deployments can fail for any of the following issues:
- A coding error
- A bug or undocumented behavior of a library
- An incorrect assumption
- An issue with the vendor
Rollback plans ensure that you can restore the application to a functional state, reducing the impact on your end users and preserving your brand image.
Use multiple environments: In addition to a production environment, most organizations maintain a development (DEV) environment and a quality assurance (QA) environment. As you promote code or other changes between the environments, you should test at each stage.
- Developers working in their local environment or workstation should test their changes before pushing the code to the development environment.
- Thoroughly test the application in the development environment before you promote it to the QA environment.
- Within the QA environment, the QA team should perform regression testing on every aspect of the application.
- Regression testing ensures that the new features work and that they don’t negatively impact existing functionality.
- After you promote the new version to the production environment, perform one final test to ensure that your end users don’t experience any issues.
Monitor
To ensure that your application is always available and performing as expected, continually monitor the application for critical production issues, application performance issues, and the end-user experience.
As a best practice, use APM tooling and synthetic monitoring to monitor the application. While Rackspace Application Services is not a monitoring team, we are happy to use our tooling to help you achieve your monitoring goals. When the RAS team instruments your environment with our APM tool, we can create default alerts for the production environment. Those default alerts cover many common situations that indicate a performance issue or that could lead to a failure situation. However, because you are an expert in your application, you should discuss additional monitoring needs with us based on your knowledge of past issues and application requirements.
Communicate your Development Timeline
It is critical that you communicate with us about your development pipeline and deployment cycles.
- If you schedule your releases (preferred), we can add the release schedule to the runbook.
- If you cannot develop a scheduled release cycle, coordinate with the RAS team to develop a method by which you communicate when you release changes.
Pushing out changes to your environment can trigger multiple alerts. If we are not aware of your deployment schedule and we actively monitor your environment, we might spend support hours trying to identify the source of the alert.
When your runbook contains detailed information of the transactions we monitor and the steps we take to remedy any triggered alerts, Rackspace ASEs function as your first-tier response. RAS can effectively triage and remediate many issues, which frees your team up to focus on improving your business.
Updated 26 days ago