
Rackspace Metrics concepts
To use the Rackspace Metrics API effectively, you should understand several key concepts.
This section describes the key terms and concepts that apply to Rackspace Metrics and provides an overview of the Rackspace Metrics architecture.
In addition to these key terms, Rackspace Metrics uses some of the key concepts that are also applied to Cloud Monitoring. For more information, see the Rackspace Monitoring Concepts section in the Rackspace Monitoring documentation.
Annotations
Annotations provide additional insight into numeric metrics. Annotations are used to highlight specific change events and provide additional information about these events. Annotations are displayed in Grafana, providing additional details about specific events and changes on a graph. Rackspace Metrics provides API operations to submit annotations and to retrieve them from the Rackspace Metrics database.
Data granularity defines the increments at which metric data is measured. When you fetch metrics data points by using the Rackspace Metrics API, you specify several parameters to control the granularity of data returned:
- A time range for the data points
- Either the number of data points to return or the resolution of the data to return
Rackspace Metrics supports the following granularities of data: full resolution data and rollups computed at 5, 20, 60, 240 and 1440 minute intervals.
When you query by points, the API selects the resolution that will return you the number of points that you requested. The API assumes a 30-second frequency, performs the calculation, and selects the appropriate resolution. For more information, see the Data granularity section in the Rackspace Monitoring documentation.
A data point is a value stored at a timestamp bucket. If no value is recorded at a particular time stamp bucket in a series, the value is None (null).
To ingest is the process of obtaining, importing, and processing data for later use or storage in a database. This process can involve modifying individual files by editing their content and/or formatting them to fit into a larger document.
The ingest node is responsible for consuming data via an HTTP interface. It exposes the Ingest API, which enables users to upload metric data to the Rackspace Metrics database.
A metric is a measurement of activity or state on a monitored resource. Checks gather metrics and send them to the monitoring system. Based on your configurations, a set of metrics might trigger an alarm, causing a notification to be sent. Metrics can also be used to create graphs. For more information about metrics, see the Metrics section in the Rackspace Monitoring documentation.
A metric series is a named set of data points. A series is identified by a unique name, which is composed of elements separated by periods that are used to display the collection of series in a hierarchical tree. For example, a series that stores the system load average on a server called apache02 in the DFW data center might be named dfw.servers.apache02.system.load_average.
The query node handles incoming HTTP-based queries, returning raw or aggregate data for a given time period. It exposes the Query API, which enables users to submit queries to the Rackspace Metrics database by using a set of query parameters.
The resolution is the number of seconds per data point in a metric series. Series are created with a resolution which determines how often a data point can be stored. This resolution is represented as the number of seconds in time that each data point covers. A series that stores one data point per minute has a resolution of 60 seconds. Similarly, a series that stores one data point per second has a resolution of 1 second.
A rollup performs functions on a set of data that has been ingested, such as downsampling calculations and summarizing raw data to condense the size of the original data sample.
The rollup node performs calculations on the metrics data that has been ingested. The rollup node performs downsampling calculations and summarizes raw data, persisting l ower-resolution aggregates.
A timestamp is a point in time at which values can be associated. Time in Cloud Metrics is represented as epoch time with a maximum resolution of 1 second.
The Rackspace Rackspace Metrics architecture includes the following components:
- An API node, which consists of the Rackspace Metrics engine and Repose. The API node provides the Ingest API and Query API to ingest and query data.
- A Cassandra database, which is used to store metrics.
- An Elasticsearch search engine, which enables users to query and filter metrics.
- A node, which performs the calculations to down sample and aggregate
The following diagram provides an overview of the Rackspace Metrics architecture.
Rackspace Metrics architecture diagram
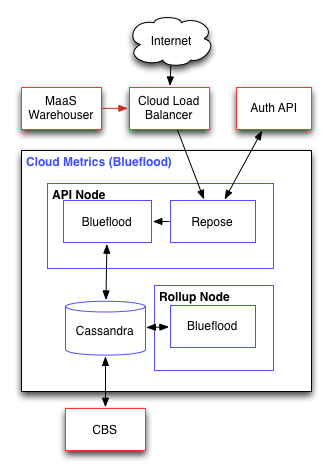
After signing up for the service, a user of Rackspace Metrics can push captured measurements to the system through the Ingest API over one of the supported protocols. After a period of time ranging from minutes to years, the user can use the Rackspace Metrics Query API to retrieve data to perform tasks such as data analysis and troubleshooting.