To understand the Cloud Images service and API, review the following key terms and concepts. To use the Rackspace Monitoring API effectively, you should understand the following key concepts:
An account contains attributes describing a customer’s account, including the Id. The account description contains mostly read-only data; however, a few properties can be modified with the API, such as the metadata and webhook_token. For more information, see Update properties on an account.
An alarm contains a set of rules that determine when the monitoring system sends an alert through a configured notification. You can create multiple alarms for the different checks associated with an entity, though each alarm you create will be associated with a single check. For example, if your entity is a web server that hosts your company’s website, you can create one alarm to monitor the server itself, and another alarm to monitor the website.
When an alarm is triggered it alerts the associated notification plan to send notifications. This process is called the “alerting workflow.”
The alarm language lets you pinpoint the value that will trigger the alarm. To learn how to use the alarm language to create robust monitors, see Alert triggering and alarms.
Checks and Check Types
Once you’ve created an entity, you can configure one or more checks for it. A check is the foundational building block of your monitoring configuration, and is always associated with an entity. The check specifics the parts or pieces of the entity that you want to collect data from, the collection frequency, how many monitoring zones are launching the check, and so on.
You can associate one or more checks with an entity. In order to monitor a resource, an entity must have at least one check, but by creating multiple checks for an entity, you can monitor several different aspects of a single resource.
For each check you create, you designate a check type. The check type specifies what kind of data to collect, PING, HTTP, SMTP, and so on. There are are two major check types: remote and agent. Rackspace Monitoring check types are fully described in the Check Types section.
Note that checks only gather metrics. A check specifies what data are collected and how they are collected; it does not trigger an alert, or a notification action. Instead, alerts are triggered by alarms based on your notification configuration.
In Rackspace Monitoring, an entity is the object or resource that you want to monitor. Entities are automatically created for for the Rackspace products that have monitoring integration, like Cloud Servers and Cloud Databases. You can also create entities yourself. For more information, see the API operations reference for the entity resource.
All objects in the monitoring system are identified by a uniquely generated identifier, generally expressed as Id, that consists of a two-character type prefix followed by a string of alphanumeric characters. You use an object’s Id when you want to perform operations on it. For example, when you want to create a check and associate it with an entity, you must know the entity’s Id.
A metric is a measurement of activity or state on a monitored resource. Checks gather metrics and send them to the monitoring system. Based on your configurations, a set of metrics may trigger an alarm, causing an alert to be sent. Metrics can also be used to create graphs.
For more information, see the API operations reference information for Cumulative and instantaneous metrics.
The monitoring agent provides insight into the internal workings of your servers with checks for information such as load average and network usage. It complements the availability data you can gather with the remote checks types. The agent operates as a single small service that runs checks that you configure and pushes metrics to the rest of Rackspace Monitoring so that the metrics can be analyzed, alerted on, and archived. These metrics are gathered via checks using specified agent check types, and can be used with the other Rackspace Monitoring features such as alarms. See the Agent check types reference for a list of agent check types.
To learn about installing and configuring monitoring agents, read the Install and configure section.
When you create a remote check, you specify which monitoring zone(s) you want to launch the check from. A monitoring zone is the point of origin or “launch point” of the check. This concept of a monitoring zone is similar to that of a datacenter, however in the monitoring system, you can think of it more as a geographical region.
You can launch checks for a particular entity from multiple monitoring zones. This enables you to observe the performance of an entity from different regions of the world. It is also a way to prevent noisy alarms. For example, if the check from one monitoring zone reports that an entity is down, a second or third monitoring zone might report that the entity is up and running. This gives you a better picture of an entity’s overall health.
A notification is a rule specifying how and to whom an informational message should be sent when an alarm is triggered. Set up of the notification rules are determined by the specified notification type. Rackspace Monitoring currently supports webhooks, email, PagerDuty, SMS, and VictorOps notification types for sending notifications.
A notification plan contains a set of notification rules to execute when an alarm is triggered. A notification plan can contain multiple notifications for each of the following states:
- Critical
- Warning
- OK
Once you’ve set up your monitoring to your satisfaction, there may come a point when you don’t want to receive notifications for a set time period (e.g. a period of scheduled maintenance). In this situation, you can choose to set up a suppression. A suppression silences the notifications from an alarm or a set of alarms for a given amount of time. For more details and examples, see the API operation reference for the Suppressions resource.
Rackspace Monitoring helps you track all your resources; from websites to web servers, routers, load balancers, and more. The following image illustrates a basic monitoring workflow.
Figure: Rackspace Monitoring workflow
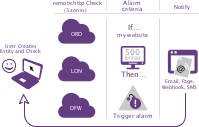
- You create an entity to represent the item that you want to monitor. For example, the entity might represent a website or web server.
- You attach a predefined check to the entity. For example, you could use the remote.http check to monitor your website’s connectivity. You can run your checks from multiple monitoring zones to provide redundant monitoring. You can also use voting logic to reduce noisiness.
- You create notifications (a message sent to one or more addresses) and notification plans (a set of notifications). For example, you might create a notification to specify that Cloud Monitoring send an email when a specific condition is met.
- You define one or more alarms for each check and associate the notification plan with the alarm. The alarm configuration specifies the conditions under which the metrics returned by the check will trigger the alarm. When the configured condition is met, the alarm is triggered and the associated notification plan is put into action. For example, your alarm might specify an HTTP response code. If this code is returned, the alarm sends you an email, or sends a webhook to a URL.
Rackspace Monitoring also provides the optional Monitoring Agent which you install on the servers you want to monitor. While Rackspace Monitoring can poll your servers from multiple data centers, the agent gathers information locally on the server. The agent gathers:
- Host information regarding network configuration, process tables, and disks to stay current with frequent system configuration changes.
- Host metrics such as swap, CPU, disk, filesystem, and network device usage.
Some examples of agent checks include:
- Memory
- CPU
- Disk
- Network
- Custom (user-definable plug-ins able to monitor any process or statistic on a server or from an application)
The Install and configure section tells you how to get the Monitoring Agent up and running.