Support for external monitoring tools
External or third-party monitoring tools refer to monitoring tools that are external to the cloud platform. Rackspace Technology current supports the following tools:
- New Relic
- Datadog
- Prometheus Alertmanager
Rackspace support of third-party tools is limited to the following:
- Rackspace ingests only events from these sources and follows the documented monitoring runbooks.
- Rackspace will not access these tools for any purpose. You are responsible for configuring and managing alerts.
- If an equivalent monitor is available in the cloud vendor native tool, Rackspace recommends using these monitors, which enable Rackspace to better support the end-to-end workflow.
- Rackspace provides recommended configuration settings and documentation to help you configure your monitoring tools to send events to the Rackspace ticketing system.
- Rackspace works closely with you to ensure that the monitoring setup is working as expected, but you are ultimately responsible for the monitoring configuration.
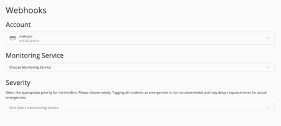
Getting the webhooks#
This section describes how to access webhooks for your third-party monitoring tool.
Note :If you are using cloud vendor native tooling, such as AWS CloudWatch, Azure Monitoring, or GCP Cloud Monitoring, you don’t need to do any additional setup. Rackspace automation configures cloud vendor native tools for all customers as per the service offering.
-
Log in to the Rackspace Monitoring portal.
The Webhooks page should display.
-
In the Account section, select the account for which you want to add the monitoring tool.
Note :Each account has its own set of webhooks, so be sure to configure your monitoring tool for the right account.
-
In the Monitoring Service section, select the tool that you want to add to your account.
-
In the Severity section, choose the appropriate priority level for incidents reported by your monitoring tool.
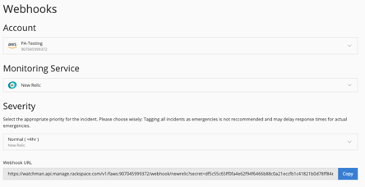
The webhook has the following format:
- Base URL - https://watchman.api.manage.rackspace.com/
- Version - API version. Currently v1 only
- Cloud Account - The account type and number. For example,
faws:accountNumber,azure:subscriptionID, orgcp:projectName - Webhook/service - Service is the monitoring tool. For example,
webhook/newrelicorwebhook/datadog - Secret - A unique value to the corresponding cloud account and severity combination
- Severity - The supported severity levels are low, normal, high, urgent, and emergency.
-
Copy or save the webhook and use it to configure your monitoring tool. For more information about configuring tools, see Configure your monitoring tool.
If you have any issues, see Troubleshooting.
Updated 5 months ago