Monitor Rackspace SDDC Flex VM usage and billing
The vRealizeTM OperationsTM Tenant App for VMware Cloud Director® (hereafter referred to as Operations Manager) provides tenant users visibility into the performance of your Rackspace SDDC Flex environment.
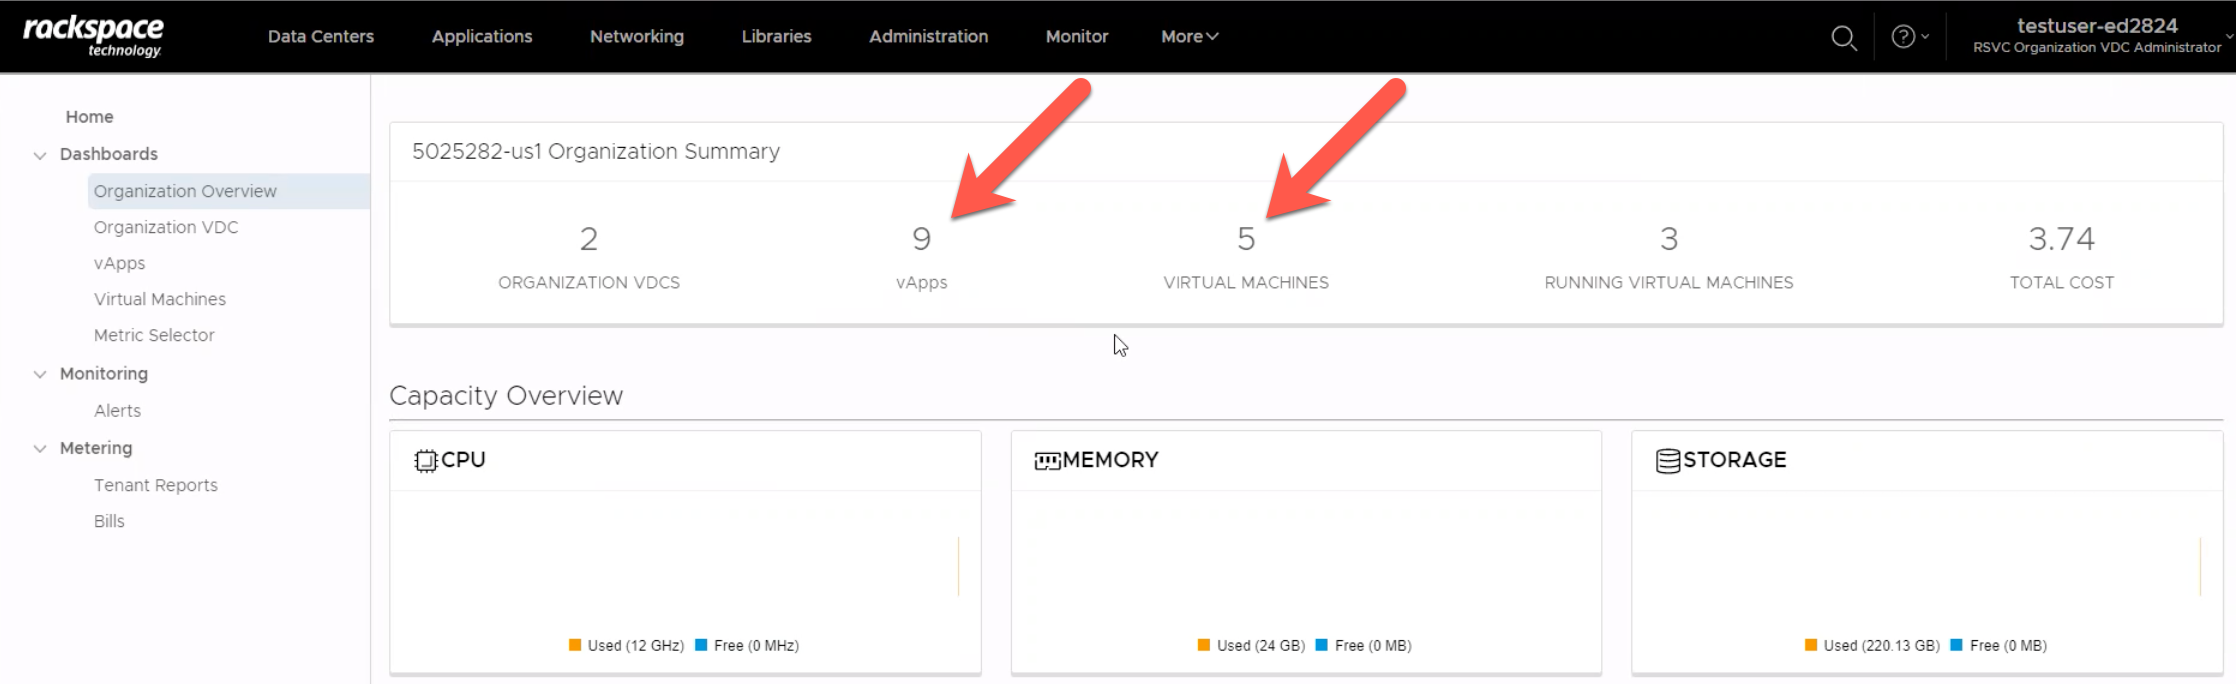
Important: The Operations Manager counts every VM as a vApp. This is not a bug but rather is a legacy of previous versions of VMware Cloud Director that required all VMs to deploy on a vApp. While VMs no longer need VApps to deploy, the system creates ghost vApps for each standalone VM. You only see the ghost vApps in the Operations Manager. This limitation does not impact how your environment functions.
In the following example, the Operations Managers reports that the environment includes five VMs and nine vApps. However, the environment includes five VMs (with each VM also counted as a vApp) and four vApps.
Open the Operations Manager
Complete the following steps to open the Operations Manager module:
- Log in to the Rackspace SDDC Flex portal.
- Click More > Operations Manager.
The Operations Manager dashboard appears.
Understanding Operations Manager dashboards
The Operations Manager contains the following dashboards that you can use to understand usage and better plan capacity.
| Dashboard | Description |
|---|---|
| Organization overview | Provides a summary of your organization VDCs and VMs, including CPU, memory, and storage capacity statistics. |
| Organization VDC | Provides a list of your organization VDCs from which you can drill down to see more detail for a specific VDC. |
| vApps | Provides a list of vApps from which you can drill down to see the VMs included in the vApp. |
| Virtual Machines | Provides a list of all VMs in your environment. |
| Metric Selector | Select from several predefined metrics to understand how the resources in your environment are performing. While there are many metrics from which you can choose, you might find the following metrics useful: CPU Usage_Average (%): The average VM CPU usage (MHz) divided by total VM CPU capacity (MHz). The system samples data every five minutes. UsageMHzAverage: The average VM CPU usage (MHz). The system samples data every five minutes. Memory Workload %: The average VM memory utilization divided by the total amount of memory. The system samples data every five minutes. Network Transmitted_average: The aggregate data transmit rate (KBps). The system samples data every five minutes. Receivedaverage: The aggregate data receive rate (KBps). The system samples data every five minutes. Usageaverage (%): The total data usage rate, which is the sum of transmitted average and received average rates. The system samples data every five minutes. Storage TotalReadLatencyaverage: The average VM read I/O response time (ms). The system samples data every five minutes. totalWriteLatency_average: The average VM write I/O response time (ms). The system samples data every five minutes. |
| Bills | View your bill and the usage charges for compute, network, and storage resources. You do not pay your bill in the Operations Manager. |
Updated 5 months ago