Viewing Logs
- Login to firewall.

- Once logged in, navigate to the monitor section by clicking on the Monitor tab located at the top of the page.

- Now that you are on the Monitor page, select the log type from the list of options located in the navigation pane located on the left side of the page.
- In this example we are reviewing traffic logs. To view traffic logs select Traffic from the list of options in the navigation pane located on the left side of the page. From this page you can review all traffic logs for traffic that matches security policy rules that have logging enabled. Filters can be applied to view traffic logs that match specific criteria.

- There are several ways to create log filters. One method is to click on any of the log attribute values. In this example an IP address (8.8.8.8) in the Destination column and a port (53) from the To Port column are selected by clicking on them. Click on the arrow icon ➡️ located on the right of the filter field to apply the filter. Additional examples can be found here.

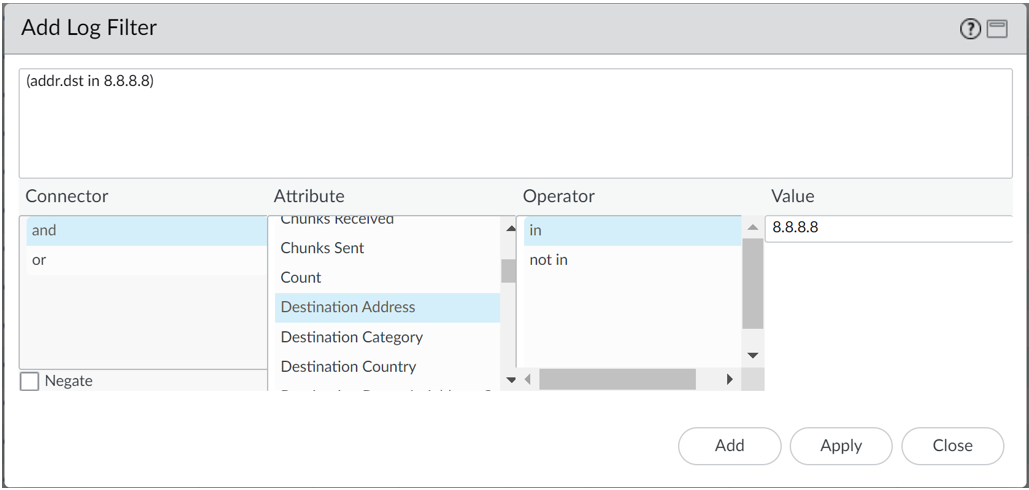
- Another method to filter logs is to use the filter tool to help write filters. Click on the plus icon ➕ located to the right of the filter field to access the tool.

- Within the filter tool you can write filters by selecting a connector, attribute, operator and value. Click Add to add your filter to the log filter box. Once you have added all of your filter criteria click Apply to apply the filter to the filter field. Click on the arrow icon ➡️ located on the right of the filter field to apply the filter.

- The process to view other log types is similar to the process demonstrated in this document. When creating filters for the other log types be aware that some filters may be interchangeable between certain log types, but most have attributes that are specific to each type so your filters will need to account for those differences. Additional information about log types and fields are linked here, log types and fields.
- In addition to filtering logs, you can drill into individual logs by clicking on the spyglass located to the left of each log entry.

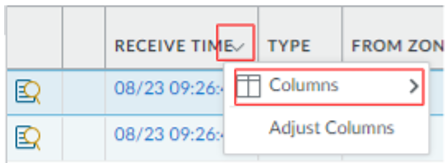
- Lastly, additional log attributes/columns can be added to your view by hovering over any one of the available column header names so that a downward arrow populates. Once the downward arrow populates, select the Columns option and additional columns will populate for you to select from.

Updated 7 months ago
