Use Annotation Metrics
Grafana® is a popular dashboard tool for IT Ops. We designed Rackspace Metrics to meet the functional and performance requirements of enterprise-scale metrics. By integrating with Grafana, Rackspace Metrics changes the cost-structure of metrics collection by replacing the storage component without changing the users' workflow.
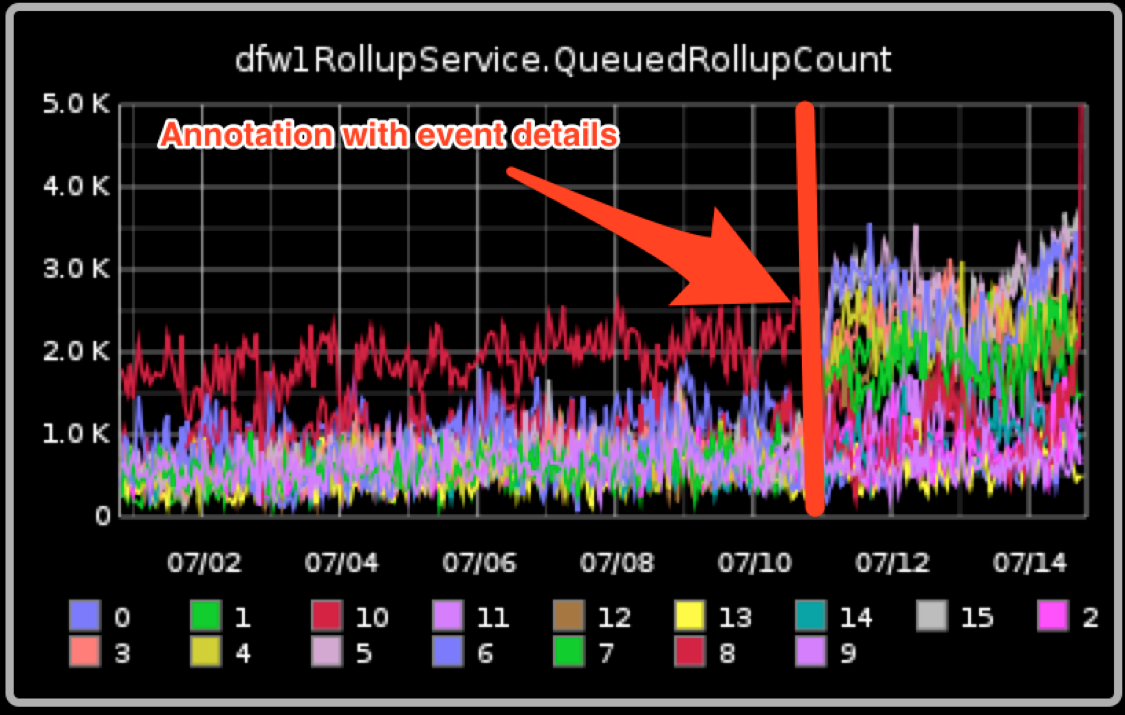
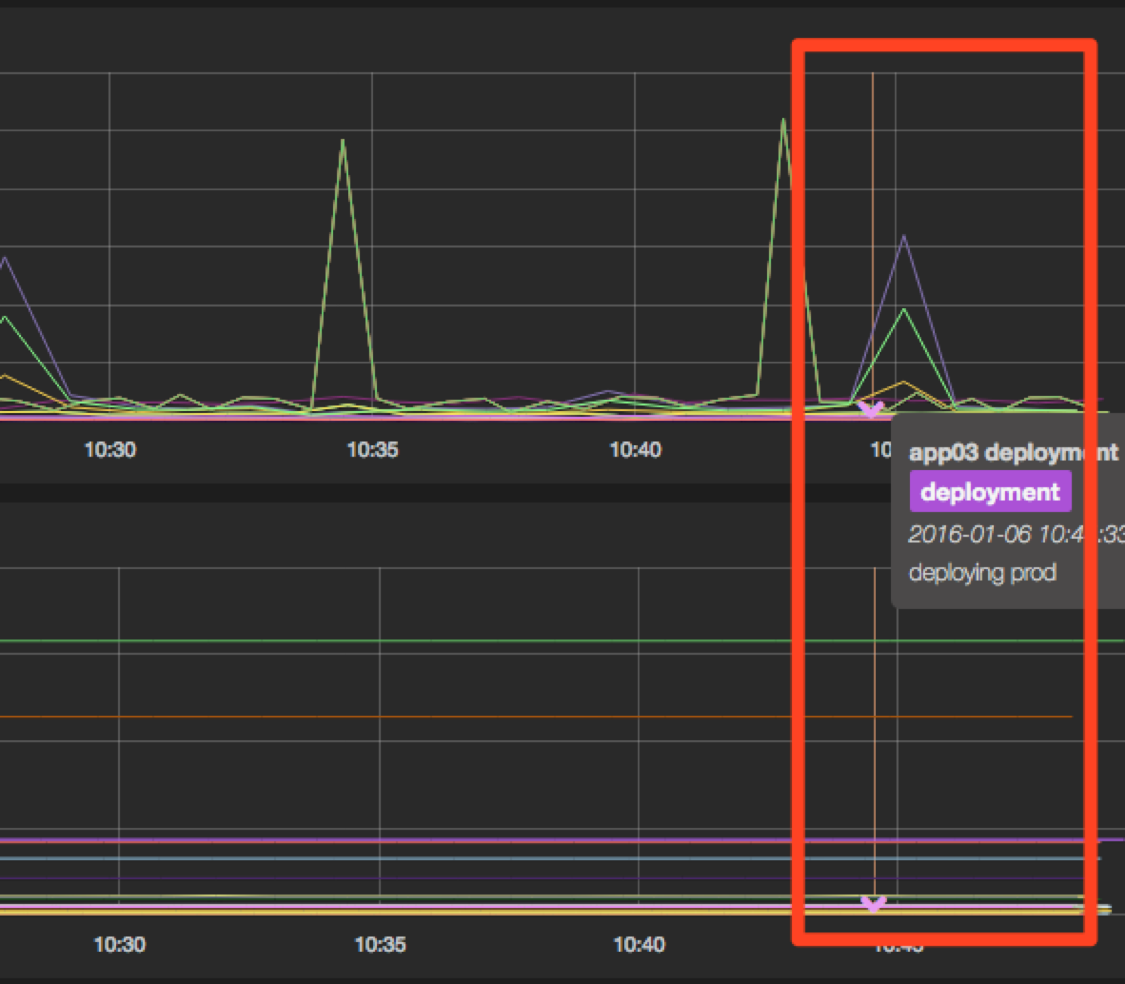
When annotations sent to Rackspace Metrics appear in a Grafana dashboard, customers can get insight into the events that might have caused the changes in the performance graph.
Annotations
The concept of annotations traces back to a blog post by the Etsy team. The post explains how they used annotations to make events like releases appear in the performance graph, which provided valuable information about the changes on the graph.
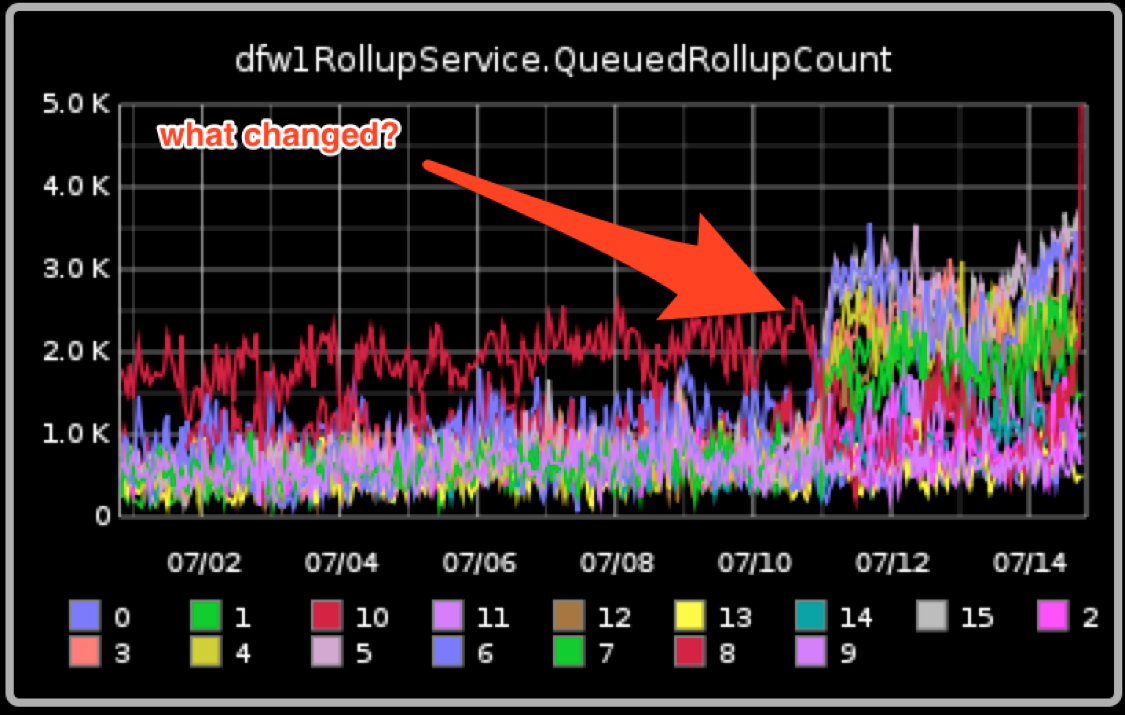
Through Grafana, Rackspace Metrics users can create a dashboard to help identify the performance changes in a system. Although detection is the first step toward managing the application, the next step is to determine what has changed.

With annotation support, users can submit information about change events that appears with the graph. These annotations add information for the graph on the dashboard.

Submit annotations through the API
You submit annotations for events through the /events API endpoint, as shown in the following example:
curl https://global.metrics-ingest.api.rackspacecloud.com/v2.0/737305/events -X POST -d '{
      "what": "app03 deployment",
      "when": 1452105873000,
      "tags": "deployment",
      "data": "deploying prod"
    }
' -H 'X-Auth-Token: e0247392bdd04ef0afa4f0b868fe99a4' -H 'Content-Type: application/json' -H 'Accept: application/json'
The value for thewhenfield is the epoch time in milliseconds. To convert the date strings to and from epoch time, you can use the dating method in Mac OS X® or use https://www.epochconverter.com/.
> date +%s
1452101351

> date -j +%s -f "%a %b %d %T %Z %Y" "Mon Jan  4 12:43:57 PST 2016"
1451940237

> date -j -f "%m/%d/%Y %T %Z" "01/04/2016 12:43:57 PST" +%s
1451940237

> date -r 1451940237
Mon Jan 4 12:43:57 PST 2016
For more information about this operation, see Send an annotation.
Add annotations to a Grafana dashboard
-
In the upper-right corner of the dashboard, click the gear icon to open the Settings window.
-
Click the Features tab.
-
Select the Annotations check box to enable annotations.
-
On the Add tab, enter a name for the annotation and select RackspaceMetrics as the data source.

-
In the Blueflood event tags field, search for the annotation's tag.
-
Click Add.

The new annotation appears in Grafana.

Retrieve annotations from the API —optional.
If you want to use the API to retrieve data about your annotations, use the following command:
curl -i -X GET 'https://global.metrics.api.rackspacecloud.com/v2.0/737305/events/getEvents?from=1452105863000&until=1452105883000' \
> -H "Content-Type: application/json" \
> -H "Accept: application/json" \
> -H "X-Auth-Token: AABlXo00elZk9FEtn2MGz8QQ9v3GD86AEZ_LbMe3yHyC43GE9pTFNXqVxYLq92FPwED0sDkYS8c1R222AWMS1y4nqTG3NmRofHmj4S0lfPsz3YXBTtFaXDac"
HTTP/1.1 200 OK
Date: Wed, 06 Jan 2016 18:45:38 GMT
Via: 1.1 Repose (Repose/6.0.2), 1.1 540559-DFW1WWSG03.secops.rackspace.com
Access-Control-Allow-Origin: *
Server: Jetty(9.2.z-SNAPSHOT)
Content-Length: 114
Age: 0

[{"tags":"deployment","tenantId":"737305","what":"app03 deployment","when":1452105873000,"data":"deploying prod"}]
For more information about this operation, see
Retrieve an annotation.
Troubleshooting
If you don't see an event for which you created an annotation, ensure that all your API calls return a 200 OK response code.
If the response code is 403 Forbidden and your API calls to other endpoints (like Rackspace Monitoring) with the same tenant and authentication token works, check with the Metrics team to ensure that the account is in the EAP program.
Also, verify that the dates of the events are within the time window specified by the query.
More information
To learn more about the Rackspace Metrics product, see the Rackspace Metrics Overview.
Use the Feedback tab to make any comments or ask questions. You can also click Let's Talk to start the conversation.
Updated 25 days ago
