Create custom graphs of activity in Rackspace Intelligence
You can customize your Rackspace Intelligence graphs by choosing how to focus:
- Focus on a single metric, comparing it across multiple entities.
- Focus on a single entity, examining it with multiple metrics.
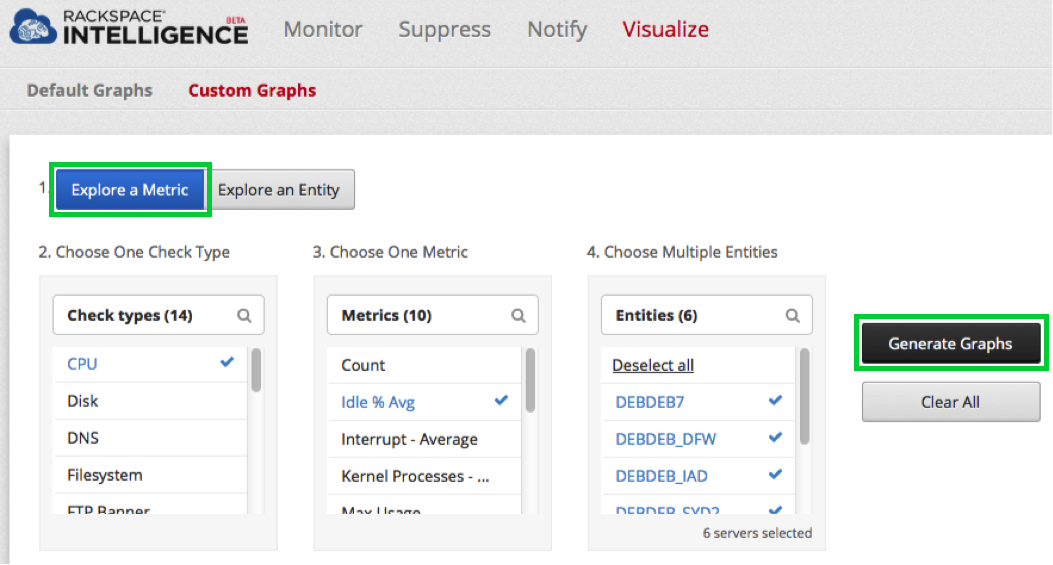
Explore a metric
When you focus on a single metric, you can simultaneously view that metric on any of the entities you have defined. For example, you can choose to see the percentage of idle time for all your entities.
Explore an entity
When you focus on a single entity, you can simultaneously view any of the metrics available for that entity. For example, you can choose to see the entity's percentage of idle time and its maximum usage.
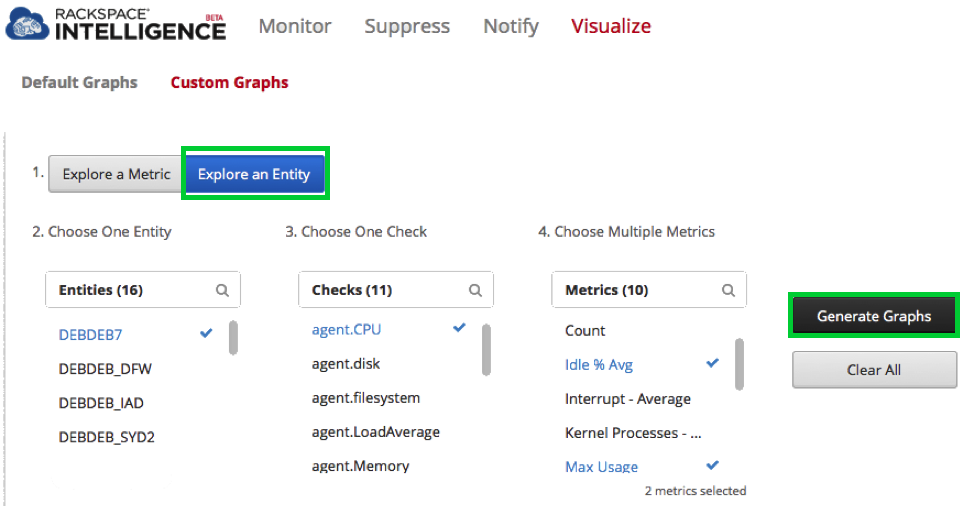
Generate graphs
After you have selected the combination of entities and metrics that you want to view, click Generate Graphs.
Rackspace Intelligence generates the graphs for the selected entities and metrics. You can choose a preset time frame or create a customized time frame for which you want to generate metrics.
- To change the values for your preset time frame, simply click on one of the preset time ranges.
- To generate graphs for a custom time range, click Custom, select the appropriate date and time for the start and end dates, and then click Apply.
Rackspace applies the selected time range to display the graphs for your selected checks.
Updated 4 months ago